KPI — September 2021: State of the Economy

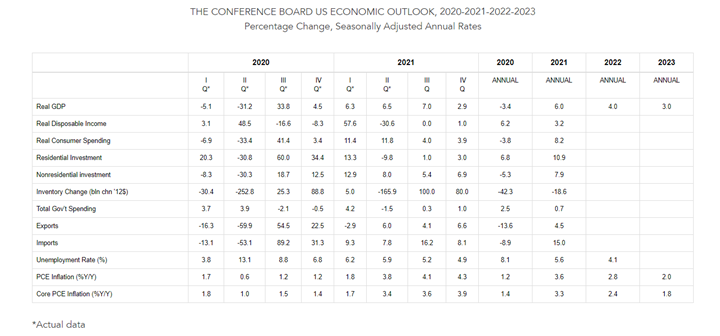
The Conference Board forecasts U.S. real GDP growth will be 7% (annualized rate) in Q3 2021 and 6% (year-over-year) in Q4 2021. Following a steady economic rebound in H1 2021, economic recovery is expected to continue throughout the year but slow to a more moderate level. As such, The Conference Board is adjusting its annual growth forecasts.
Important Takeaways, Courtesy of The Conference Board:
- Bottlenecks in global supply chains are hampering growth potential. As businesses struggle to sustain elevated demand for many goods, there continues to be a sharp contraction in private inventories. This trend may reverse in the coming months, as the holiday season approaches and a large rebound in private inventories is expected.
- There is trepidation about a surge in mortgage defaults and renter evictions as government protections begin to expire. While still elevated, the number of mortgages in serious delinquency and the number of U.S. households reporting they are behind on rent are both down from earlier this year and 2020.
- Year-over-year inflation rates will likely continue to climb through the end of 2021 and into early 2022 due to sizeable base effects.
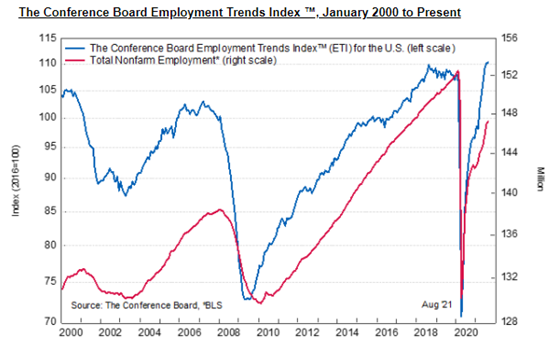
Additionally, “The growth rate of the Employment Trends Index slowed in the past two months, reflecting the Delta variant’s impact on economic activity, especially in-person services,” said Gad Levanon, head of The Conference Board Labor Markets Institute.
“We continue to monitor two trends, which could put a damper on employment growth. First, the number of new COVID-19 infections continues to increase, holding back economic and job market recovery. Second, the labor market continues to experience historical recruiting difficulties,” he said.
According to a survey of the National Federation of Independent Business, 50% of small employers reported difficulty filling positions in August, an all-time high accompanied by rapidly rising wages. Towards the end of 2021, these severe labor shortages may ease as enhanced unemployment benefits expire and schools reopen, leading more workers to return to the labor market.
“We expect another month of sub-par job growth in September, but strong job growth likely will resume in the last quarter of 2021. Since COVID-19 is not going away anytime soon, a return to normal spending on, and employment in, in-person services is unlikely to happen in 2021,” added Levanon.
Employment
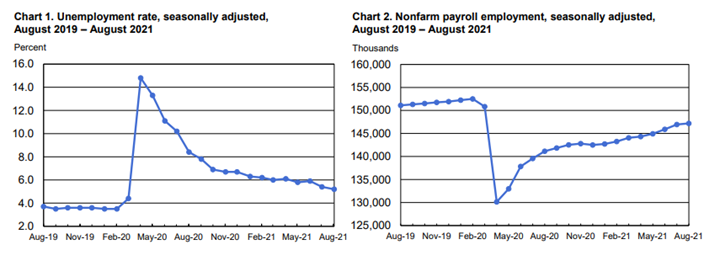
Job creation for August was “a huge disappointment,” with the economy adding 235,000 positions versus expectations of 720,000, said Jeff Cox of CNBC. The unemployment rate declined by .2 percentage points to 5.2%, according to the U.S. Bureau of Labor Statistics.
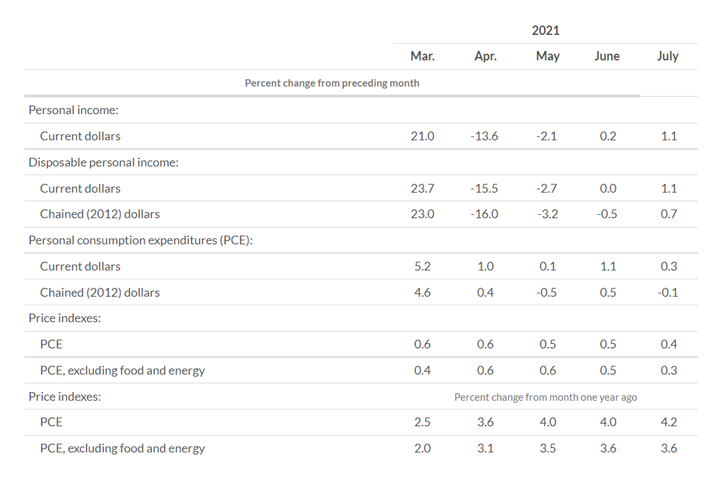
According to the U.S. Bureau of Economic Analysis (BEA), the increase in personal income in July primarily reflected increases in government social benefits and compensation of employees. Within government social benefits, an increase in “other” social benefits (more than accounted for by advance Child Tax Credit payments as authorized by the American Rescue Plan) was partly offset by a decrease in unemployment insurance, reflecting a decrease in payments from the Pandemic Unemployment Compensation program. Personal outlays increased $45.4 billion, while personal saving was $1.72 trillion and the personal saving rate – personal saving as a percentage of disposable personal income – was 9.6%.
Important Takeaways, Courtesy of the Bureau of Labor Statistics:
- Among the unemployed, the number of job leavers – that is, unemployed persons who quit or voluntarily left their previous job and began looking for new employment – increased by 164,000 to 942,000 in June; an update of this data point is missing from the July and August reports.
- The number of persons on temporary layoff (1.3 million) was essentially unchanged in August. This measure is down considerably from the high of 18 million in April 2020 but is 502,000 above the February 2020 level.
- Among the unemployed, the number of permanent job losers declined by 443,000 to 2.5 million in August but remains 1.2 million higher than in February 2020.
- The number of long-term unemployed (those jobless for 27 weeks or more) decreased by 246,000 in August to 3.2 million but remains 2.1 million higher than in February 2020. Long-term unemployed account for 37.4% of the total unemployed in August.
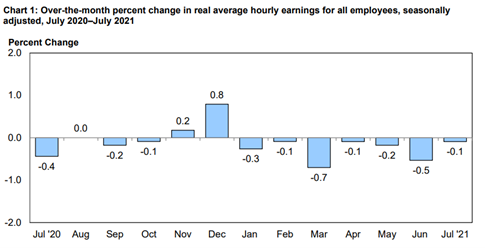
According to the U.S. Bureau of Labor Statistics, real average hourly earnings for all employees decreased .1% from June to July, seasonally adjusted. This result stems from an increase of .4% in average hourly earnings combined with an increase of .5% in the Consumer Price Index for All Urban Consumers (CPI-U). Real average weekly earnings decreased .1% over the month due to the change in real average hourly earnings combined with no change in the average workweek. The month-over-month percent change in real average hourly earnings decreased 1.2%, seasonally adjusted. A change in real average hourly earnings combined with an increase of .6% in the average workweek resulted in a .7% decrease in real average weekly earnings over this period.
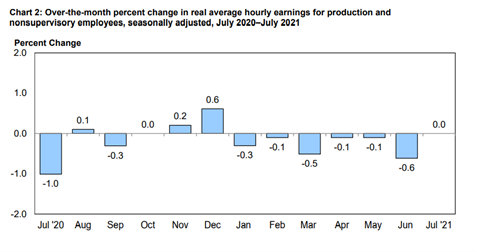
According to the U.S. Bureau of Labor Statistics, real average hourly earnings for production and nonsupervisory employees were unchanged, seasonally adjusted. This result stems from a .4% increase in average hourly earnings combined with an increase of .5% in the Consumer Price Index for Urban Wage Earners. Real average weekly earnings decreased .1% month-over-month due to the unchanged real average hourly earnings being combined with no change in average weekly hours. For production and nonsupervisory employees, month-over-month real average hourly earnings decreased 1.1%, seasonally adjusted. The change in real average hourly earnings combined with a .6% increase in the average workweek resulted in a .5% decrease in real average weekly earnings over this period.
By Demographic
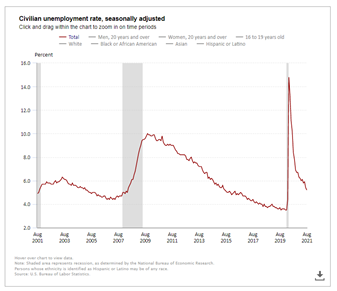
Unemployment rates among all major worker groups in August: adult women – 4.8%; adult men – 5.1%; teenagers – 11.2%; Whites – 4.5%; Asians – 4.6%; Hispanics – 6.4%; and Blacks – 8.8%.
Unemployment rates among all major worker groups in July: adult women – 5%, adult men – 5.4%, teenagers – 9.6%, Whites – 4.8%, Asians – 5.3%, Hispanics – 6.6% and Blacks – 8.2%.
By Industry
Total nonfarm payroll employment rose by 235,000 in August, following 1.1 million and 962,000 increases in June and July, respectively. Nonfarm employment rose by 17 million since April 2020 but remains down 5.3 million, or 3.5%, from its pre-pandemic level in February 2020.
Notable job gains during August occurred in professional and business services, transportation and warehousing, private education, manufacturing and other services. Employment in retail trade declined month-over-month.
“Weaker employment activity is likely both a demand and supply story – companies paused hiring in the face of weaker demand and uncertainty about the future, while workers withdrew due to health concerns,” said Joseph Song, Bank of America economist.
Important Takeaways, Courtesy of the U.S. Bureau of Labor Statistics:
- Employment in professional and business services increased by 74,000: architectural and engineering services (+19,000), computer systems design and related services (+10,000), scientific research and development services (+7,000) and office administrative services (+6,000). Since February 2020, employment in professional and business services is down by 468,000, over half of which is in temporary help services (-262,000).
- Transportation and warehousing added 53,000 jobs, bringing employment slightly above (+22,000) its pre-pandemic level in February 2020. Employment gains have been led by strong growth in couriers and messengers and in warehousing and storage, which added 20,000 jobs each. Air transportation also added jobs (+11,000), while transit and ground passenger transportation, which includes school buses, lost jobs (-8,000).
- Manufacturing added 37,000 jobs, with gains in motor vehicles and parts (+24,000) and fabricated metal products (+7,000). Employment in manufacturing is down by 378,000 from its pre-pandemic level in February 2020.
- The other services industry added 37,000 jobs, but employment is 189,000 lower than in February 2020. Employment rose in personal and laundry services (+19,000) and in repair and maintenance (+9,000).
- Employment in information increased by 17,000, reflecting a gain in data processing, hosting and related services (+12,000). Employment in information is down by 150,000 since February 2020.
- Financial activities rose by 16,000, with most of the gain occurring in real estate (+11,000). Employment in financial activities is down by 29,000 since February 2020.
- Mining added 6,000 jobs, reflecting a gain in support activities for mining (+4,000). Mining employment has risen by 55,000 since a trough in August 2020 but is 96,000 below a peak in January 2019.
- Employment in retail trade declined by 29,000, with losses in food and beverage stores (-23,000) and in building material and garden supply stores (-13,000). Retail trade employment is down by 285,000 since February 2020.
- Employment in leisure and hospitality was unchanged, after increasing by an average of 350,000 per month over the prior six months. In August, job gains in arts, entertainment and recreation (+36,000) were more than offset by a loss in food services and drinking places (-42,000). Employment in leisure and hospitality is down by 1.7 million, or 10%, since February 2020.
KPI — September 2021: Consumer Trends
Key Performance Indicators Report — September 2021


