KPI — October: State of the Economy
Economists predict growth will rise to 34.6% (annualized rate) during the third quarter, following a sharp contraction in the second quarter. Revitalizing economic output to pre-pandemic levels will take time, but “there has been some progress in driving economic activity higher over the summer, despite a sharp uptick in new COVID-19 cases,” according to The Conference Board.
Indeed, various economic indicators improved at a greater-than-expected rate during July and August; however, the pace of said rebound is slowing. “We expect U.S. economic growth to continue to improve through September, but are concerned about the sustainability of the recovery beyond that,” noted The Conference Board.
For example, labor market and consumer spending recovery are slowing down, despite continued improvements in consumer confidence. Case in point, U.S. personal savings rates remain nearly twice as high as they were in late 2019. Since consumer spending represents nearly 70% of GDP, these key demand-side metrics need to improve further to pull the U.S. economy out of recession, explained The Conference Board, which recently proposed three recovery scenarios for the U.S. economy.
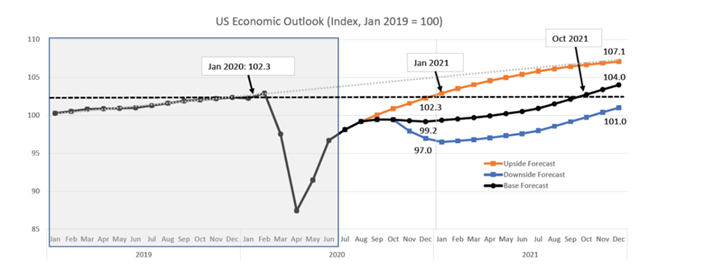
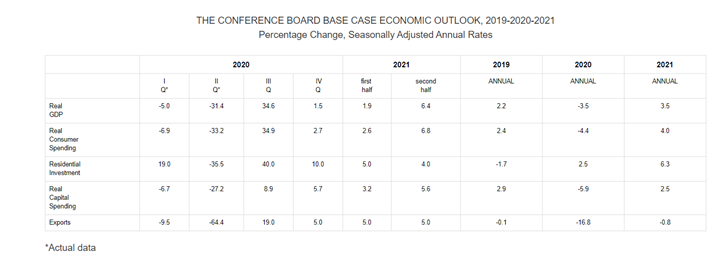
• Base Case Forecast: The base forecast includes a third quarter GDP rebound of 34.6%. Given the severity of the economic contraction in the second quarter, even a moderate improvement in economic activity over the summer will yield a strong growth rate in the third quarter. Consumer spending was the largest driver of growth during summer; however, it is expected to stall due to high levels of unemployment and elevated savings rates that will damage spending later in the year, leading to a much slower GDP expansion of only 1.5% in the fourth quarter. This results in an annual growth rate of -3.5% in 2020 and puts the U.S. economy on a recovery path of about 3.5% growth in 2021.
• Upside Forecast: Alternatively, a more optimistic scenario shows the growth momentum between May and August being sustained for the remainder of the year, albeit at a moderating pace. Furthermore, said scenario has a more optimistic outlook on the impact of unemployment and savings on U.S. consumption during the fourth quarter—resulting in a “swoosh-shaped recovery.” This upside forecast results in an annual growth rate of -2.9% in 2020 and a strong rebound of 7.1% in 2021. In this scenario, U.S. monthly economic output recovers completely to pre-pandemic levels by January 2021.
• Downside Forecast: The third forecast is a more pessimistic scenario in which the U.S. economy contracts at the end of 2020 before stabilizing in early 2021. In this “double dip” scenario, the recovery seen earlier this year falters due to (1) a large resurgence in COVID-19 cases in the coming months, (2) no additional government stimulus until at least Q1 2021, (3) delays in the development and deployment of a coronavirus vaccine and (4) a contested U.S. presidential election that damages US consumer and business confidence.
Employment
Total nonfarm payroll employment rose by 661,000 in September, and the unemployment rate declined to 7.9%. “Improvements in the labor market reflect the continued resumption of economic activity that had been curtailed due to the coronavirus (COVID-19) pandemic and efforts to contain it,” explained the U.S. Bureau of Labor Statistics.
- Among the unemployed, the number of persons on temporary layoff decreased by 1.5 million to 4.6 million. This measure is down considerably from the high of 18.1 million in April but is 3.8 million higher than in February.
- The number of permanent job losers increased by 345,000 to 3.8 million, a measure that has risen by 2.5 million since February.
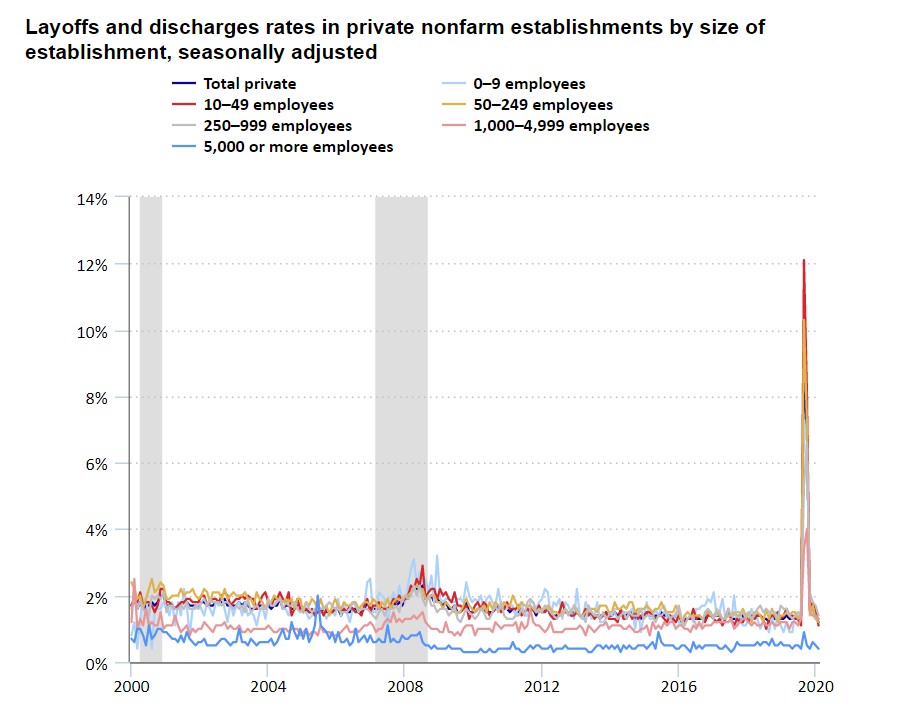
According to the U.S. Bureau of Labor Statistics, the layoffs and discharges rate in private nonfarm establishments reached a historical high of 8.8% in March 2020 as the COVID-19 pandemic took hold. The rate remained high in April at 6.9%, with layoffs and discharges rates in May, June, July and August posting similar results to pre-pandemic. Establishments with 10 to 49 employees had the highest layoffs and discharges rates in March and April, followed by establishments with 50 to 249 employees. Establishments with 1,000 to 4,999 employees experienced increases in their layoffs and discharges rates in March and April, but the rates were lower than those for smaller and medium-sized establishments. By August, there was little difference in layoffs and discharges rates by establishment size, except for the largest establishments. The rate for establishments with 5,000 or more employees reached 0.9% in March 2020. The rate was 0.4% in August, around the same rate it has been for much of its history since December 2000.
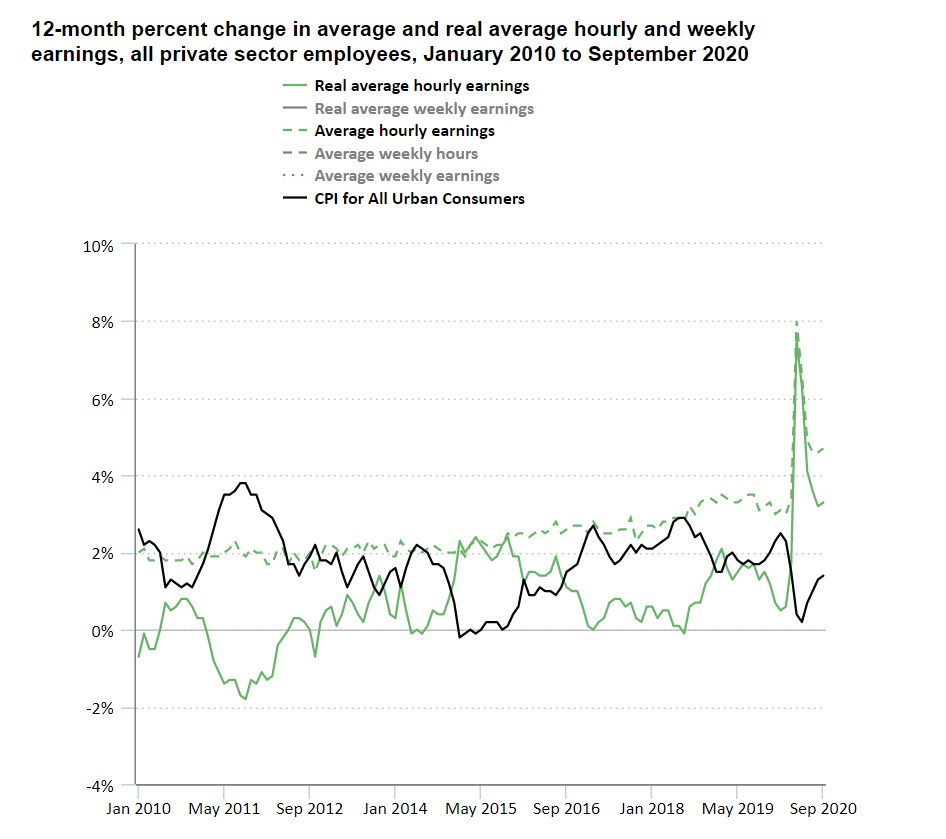
Additionally, real average hourly earnings increased 3.3% from September 2019 to September 2020, which stems from an increase of 4.7% in average hourly earnings being partly offset by an increase of 1.4% in the Consumer Price Index for All Urban Consumers, according to recent government reporting.
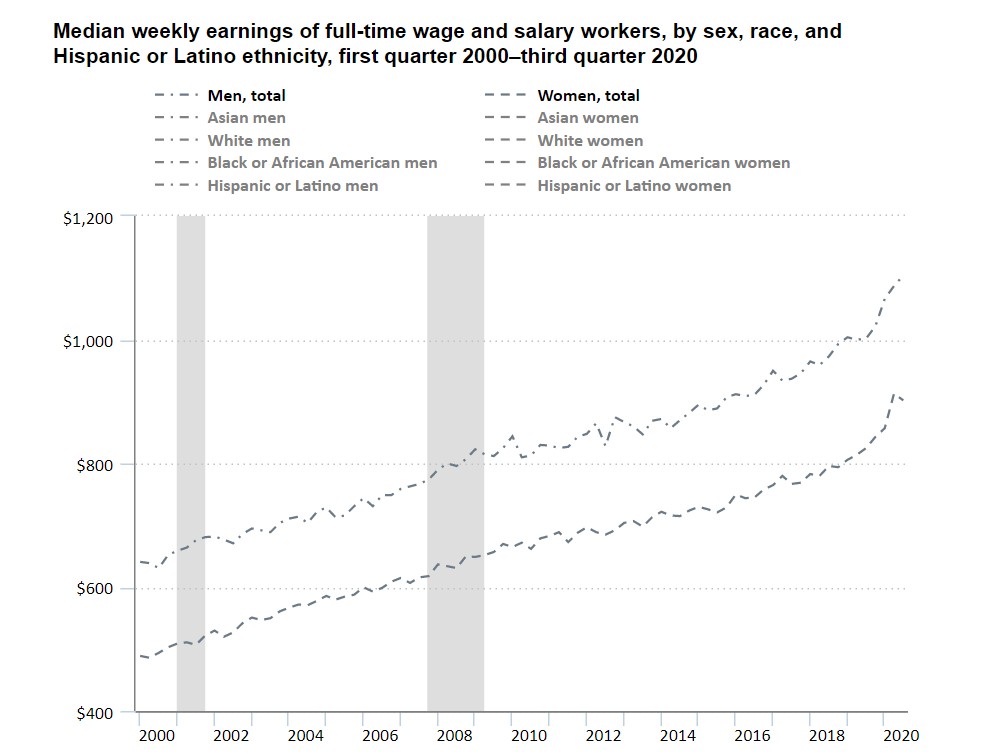
According to the U.S. Bureau of Labor Statistics, among full-time workers during the third quarter of 2020, women had median weekly earnings of $902, while men’s weekly earnings were $1,104. Median weekly earnings were $1,542 for Asian men and $1,122 for White men. Those compare with $869 for Black or African American men and $823 for Hispanic or Latino men. Median weekly earnings were $1,224 for Asian women, $910 for White women, $768 for Black or African American women and $722 for Hispanic or Latino women. Overall, women’s median earnings were 81.7% of the median for men. Asian women earned 79.4% as much as Asian men, while White women earned 81.1% as much as their male counterparts, compared with 87.7% for Hispanic women and 88.4% for Black women.
From September 2019 to September 2020, the change in real average hourly earnings combined with an increase of 0.9% in the average workweek resulted in a 5.6% increase in real average weekly earnings, according to the U.S. Bureau of Labor Statistics.
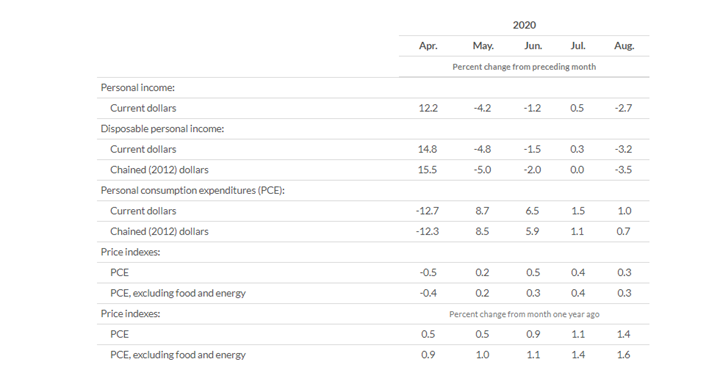
Personal income decreased $543.5 billion (2.7%), disposable personal income (DPI) decreased $570.9 billion (3.2%) and personal consumption expenditures (PCE) increased $141.1 billion (1%) during August, according to estimates released by the Bureau of Economic Analysis.
“The decrease in personal income in August (the most recent data available) was more than accounted for by a decrease in unemployment insurance benefits. In particular, the Federal Pandemic Unemployment Compensation program which provided a temporary weekly supplemental payment of $600 for those receiving unemployment benefits expired on July 31,” according to the Bureau of Economic Analysis.
By Demographic
Unemployment rates declined in September among major worker groups: adult men—7.4%, adult women—7.7%, teenagers—15.9%, Whites—7%, Asians—8.9%, Hispanics—10.3% and Blacks—12.1%.
For comparison, here is demographic data from August: adult men—8%, adult women—8.4%, teenagers—16.1%, Whites—7.3%, Hispanics—10.5%, Asians—10.7% and Blacks—13%.
By Industry
In September, the unemployment rate declined by 0.5 percentage point to 7.9%, and the number of unemployed persons fell by one million to 12.6 million. Both measures have declined for five consecutive months but remain higher than in February by 4.4 percentage points and 6.8 million, respectively, according to the U.S. Bureau of Labor Statistics.
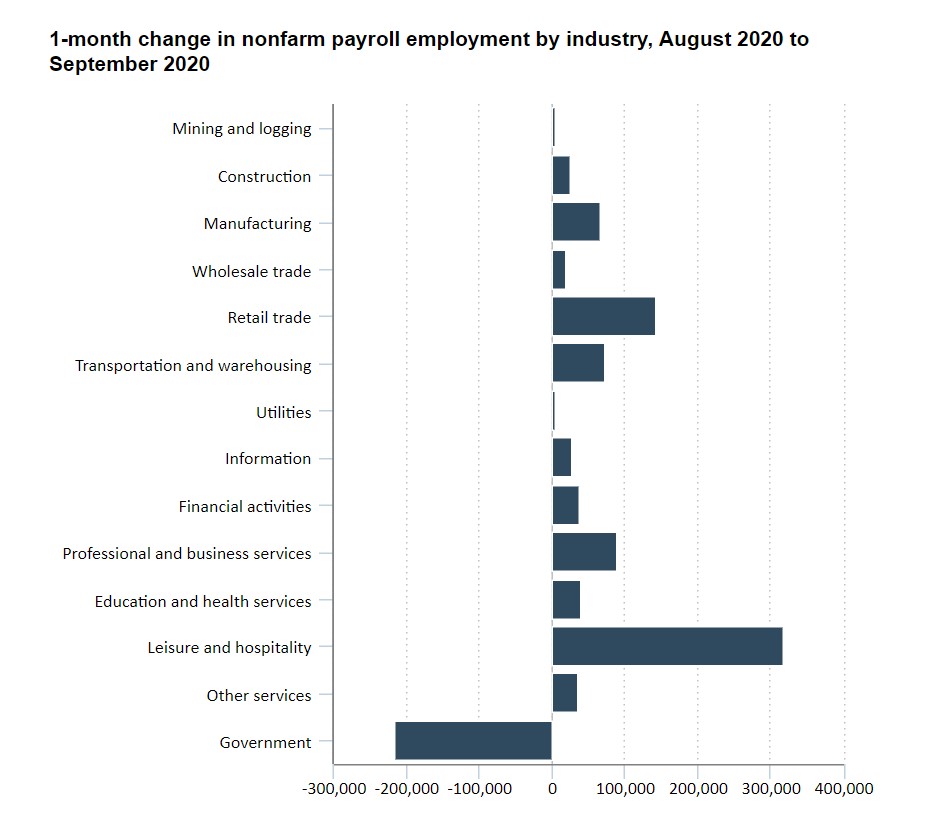
Notable job gains occurred in leisure and hospitality, retail trade, health care and social assistance, as well as professional and business services. Employment in government declined month-over-month, mainly in state and local government education.
Important takeaways, courtesy of the U.S. Bureau of Labor Statistics
- Employment in leisure and hospitality increased by 318,000, with almost two-thirds of the gain occurring in food services and drinking places (+200,000). Despite job growth totaling 3.8 million over the last five months, employment in food services and drinking places is down by 2.3 million since February. Amusements, gambling and recreation (+69,000), as well as accommodation (+51,000) also added jobs in September.
- Retail trade added 142,000 jobs over the month, with gains widespread across the industry. Clothing and clothing accessories stores (+40,000) accounted for nearly one-fourth of the month-over-month change in retail trade. Notable employment increases also occurred in general merchandise stores (+20,000), motor vehicle and parts dealers (+16,000), as well as health and personal care stores (+16,000). Employment in retail trade is 483,000 lower than in February.
- Employment in health care and social assistance rose by 108,000 but remains down by one million since February. Health care added 53,000 jobs, with continued growth in offices of physicians (+18,000), home health care services (+16,000) and offices of other health practitioners (+14,000). Social assistance added 55,000 jobs, mostly in individual and family services (+32,000), as well as child day care services (+18,000).
- Professional and business services added 89,000 jobs. Employment increased in services to buildings and dwellings (+22,000), architectural and engineering services (+13,000), as well as computer systems design and related services (+12,000). Despite gains of 910,000 since April, employment in professional and business services is 1.4 million lower than in February.
- Employment in transportation and warehousing rose by 74,000 in September, with job gains in warehousing and storage (+32,000), transit and ground passenger transportation (+21,000), as well as couriers and messengers (+10,000). Although the industry has added 291,000 jobs since May, employment in transportation and warehousing is 304,000 lower than in February.
- Manufacturing added 66,000 jobs. Durable goods accounted for about two-thirds of the gain, led by motor vehicles and parts (+14,000) and machinery (+14,000). Despite gains over the past five months, employment in manufacturing is 647,000 below February’s level.
- Financial activities added 37,000 jobs, with growth occurring in real estate and rental and leasing (+20,000), as well as in finance and insurance (+16,000). Employment in financial activities is 162,000 below the level in February.
- The other services industry added 36,000 jobs, largely in membership associations and organizations (+31,000). Employment in other services is 495,000 lower than in February.
- Employment in information grew by 27,000 but remains down by 276,000 since February. Motion picture and sound recording industries accounted for most of the September gain (+23,000).
- Construction employment increased by 26,000, with growth in residential specialty trade contractors (+16,000) and construction of buildings (+12,000). Construction employment is below its February level by 394,000.
- Wholesale trade added 19,000 jobs, with gains in both the durable and nondurable goods components (+13,000 and +8,000, respectively). Employment in wholesale trade is 312,000 lower than in February.
- Government employment declined by 216,000, with local government education and state government education falling by 231,000 and 49,000, respectively. A decrease of 34,000 in federal government was driven by a decline in the number of temporary Census 2020 workers. Partially offsetting these declines, employment in local government, excluding education, rose by 96,000.
- Employment in private education decreased by 69,000, after a gain of similar magnitude in August. Employment in the industry is down by 355,000 since February.
- Employment in mining was similar to prior month (+1,000). Employment in the industry is down by 133,000 since a recent peak in January 2019; about three-fourths of this decline has occurred since February of this year.
By Geography
Unemployment rates were lower during September in 30 states, higher in eight states and stable in 12 states (including the District of Columbia), according to the U.S. Bureau of Labor Statistics. All 50 states and the District had jobless rate increases compared to the year prior.
Additionally, nonfarm payroll employment increased in 30 states, decreased in three states and was essentially unchanged in 17 states (including the District of Columbia) during September 2020. Over the year, nonfarm payroll employment decreased in 48 states, along with the District, and was essentially unchanged in two states, according to recent reporting.
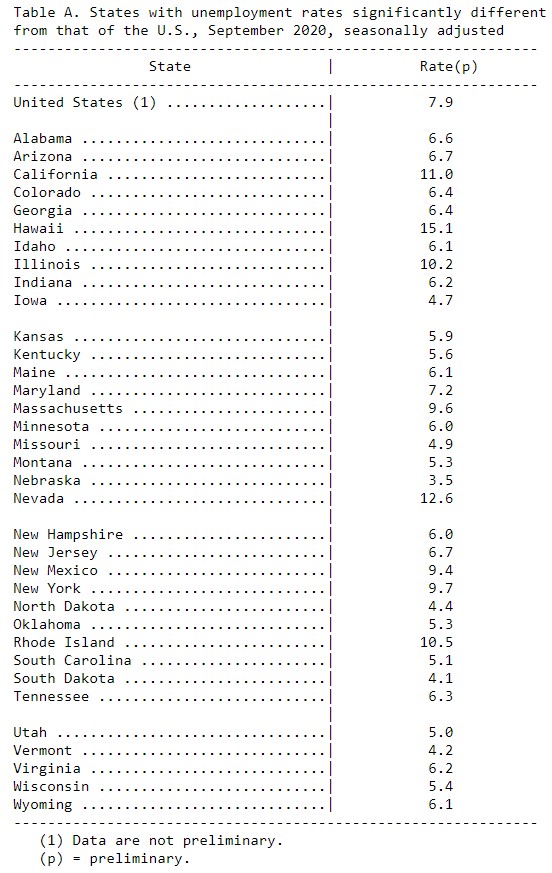
Hawaii posted the highest unemployment rate in September at 15.1%, followed by Nevada—12.6%. Nebraska recorded the lowest rate at 3.5%, followed by South Dakota—4.1% and Vermont—4.2%. In total, 27 states had jobless rates lower than the U.S. figure of 7.9%, while eight states had higher rates and 15 states (including the District of Columbia) had rates that were not appreciably different from that of the nation.
In September, the largest unemployment rate decrease occurred in New Jersey at -4.4 percentage points. Rates declined month-over-month by at least two percentage points in an additional six states, while the largest month-over-month jobless rate increases occurred in Hawaii (+2.1 percentage points) and Idaho (+1.9 points).
The largest unemployment rate increases from September 2019 occurred in Hawaii (+12.4 percentage points) and Nevada (+8.9 points), while the smallest year-over-year rate increases occurred in Nebraska (+0.5 percentage point) and South Dakota (+0.7 point).
The largest job gains occurred in New York (+109,300), California (+96,000) and New Jersey (+60,200). The largest percentage increase occurred in New Jersey (+1.6%), followed by New York and Wyoming (+1.3% each). Employment decreased in Indiana (-11,700, or -0.4%), Hawaii (-10,700, or -2%) and Kansas (-7,200, or -0.5%).
Over the year, nonfarm payroll employment decreased in 48 states (including the District of Columbia) and was essentially unchanged in two states. The largest job declines occurred in California (-1,488,900), New York (-1,102,800) and Texas (-583,600), while the smallest declines occurred in South Dakota (-13,000), Wyoming (-16,100) and Montana (-17,700). The largest percentage declines occurred in Hawaii (-18.4%), New York (-11.2%) and Michigan and Vermont (-9.6% each). The smallest percentage declines occurred in Mississippi (-2.2%), Nebraska (-2.5%)
KPI — October: State of the Manufacturing Sector
Key Performance Indicators Report — October 2020


