KPI — October: Consumer Trends

Below is a synopsis of consumer confidence, sentiment and spending trends, as well as national housing market and retail analysis.
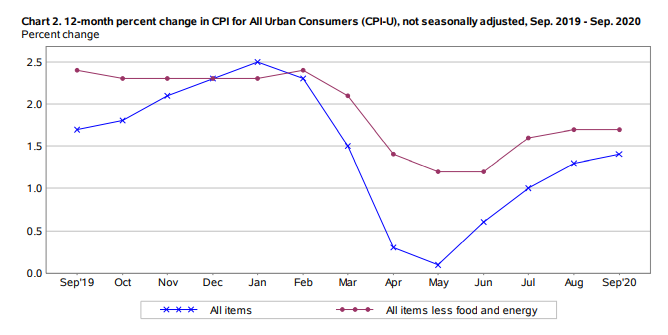
The Consumer Price Index for All Urban Consumers (CPI-U)—which measures the changes in the price of a basket of goods and services purchased by urban consumers— increased .2% on a seasonally adjusted basis in September after rising 0.4% in August and 0.6% in July. Over the last 12 months, the all items index increased 1.4% before seasonal adjustment.
In August, the monthly increase in the seasonally adjusted all items index was broad-based. A sharp rise in the used cars and trucks index was the largest factor, accounting for 40% of the increase, but the indexes for gasoline, shelter, recreation, motor vehicle insurance, airline fares, as well as household furnishings and operations also contributed positively.
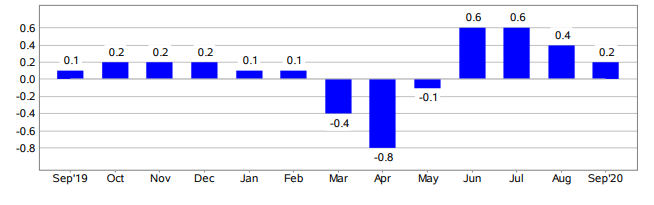
During September, the index for used cars and trucks continued to rise sharply, still accounting for most of the monthly increase in the seasonally adjusted all items index.
Important takeaways, courtesy of the U.S. Bureau of Labor Statistics
- The index for used cars and trucks rose 6.7%, its largest monthly increase since February 1969.
- The food index was unchanged, with an increase in the food away from home index offsetting a decline in the food at home index.
- The energy index rose 0.8%, as the index for natural gas increased 4.2%.
- The index for all items less food and energy rose 0.2% in September after larger increases in July and August.
- The indexes for shelter, new vehicles and recreation also increased.
- The indexes for motor vehicle insurance, airline fares and apparel were among those to decline month-over-month.
Consumer Sentiment, Confidence and Spending
The Consumer Sentiment Index—a survey consisting of approximately 50 core questions that cover consumers’ assessments of their personal financial situation, buying attitudes and overall economic conditions—finished at 80.4 in September. The index is trending up (81.2) in October’s preliminary reading conducted by the University of Michigan Survey of Consumers.
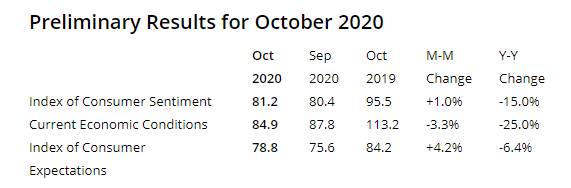
Americans grew more optimistic toward the end of September as consumer sentiment reached a six-month high, reflecting more confidence in the U.S. economy after a summer lull, noted MarketWatch.
“While consumers have anticipated gains in the national economy ever since the April shutdown, the September survey recorded a significant increase in the proportion that expected a reestablishment of good times financially in the overall economy,” said Richard Curtin, chief economist for the University of Michigan Survey of Consumers.
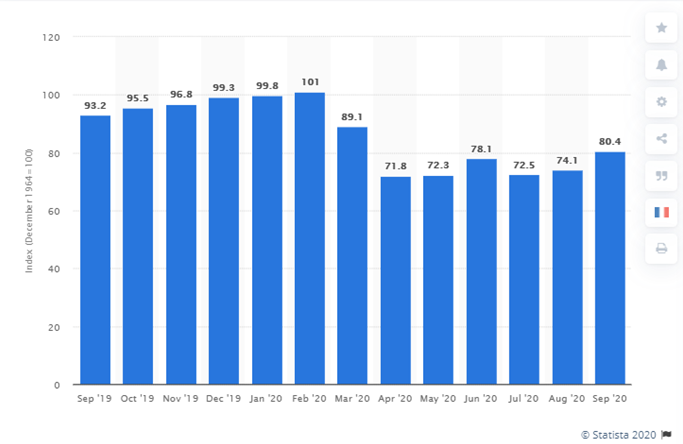
This graphic by Statista shows the U.S. Consumer Sentiment Index from September 2019 to September 2020. The index is normalized to have a value of 100 in December 1964 and based on a monthly survey of consumers, conducted in the continental United States. It consists of about 50 core questions which cover consumers’ assessments of their personal financial situation, their buying attitudes and overall economic conditions. The Consumer Sentiment Index stood at 80.4 in September 2020.
Conversely, the Conference Board Consumer Confidence Index® decreased in October after a sharp increase during September. The Index now stands at 100.9 (1985=100), down from 101.3 a month prior.
“Consumers’ assessment of current conditions improved while expectations declined, driven primarily by a softening in the short-term outlook for jobs,” said Lynn Franco, senior director of economic indicators at The Conference Board. “There is little to suggest that consumers foresee the economy gaining momentum in the final months of 2020, especially with COVID-19 cases on the rise and unemployment still high.”
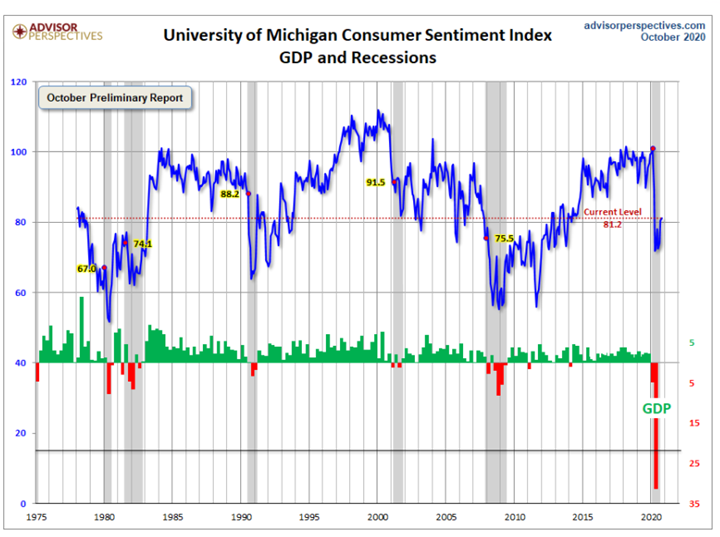
This is a long-term perspective on this widely watched indicator. Recessions and real GDP are included to help evaluate the correlation between the Michigan Consumer Sentiment Index and the broader economy, said Advisor Perspectives, a leading interactive publisher for Registered Investment Advisors (RIAs), wealth managers and financial advisors.
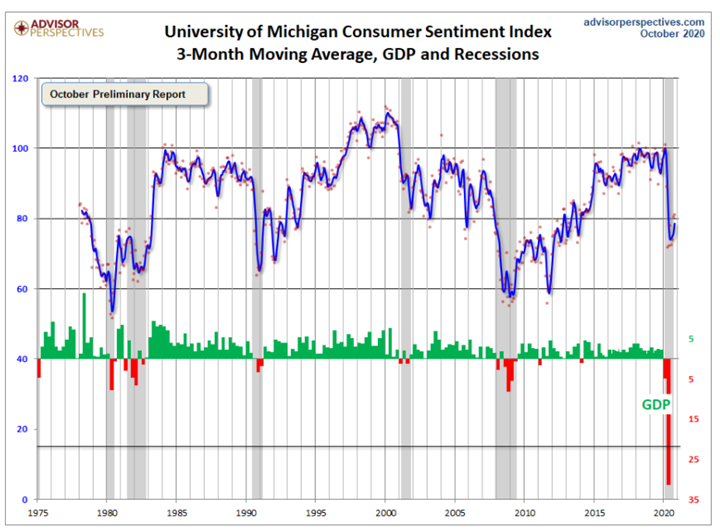
Jill Mislinski of Advisor Perspectives put the recent consumer sentiment report into larger historical context. Consumer sentiment is 5.8% below the average reading (arithmetic mean) and 4.7% below the geometric mean. The current index level is at the 32nd percentile of the 514 monthly data points in this series. Note: This indicator is somewhat volatile, with a 3.0 point absolute average monthly change. The latest data point saw a 0.8-point increase from the previous month. For a visual sense of the volatility, here is a chart with the monthly data and a three-month moving average.
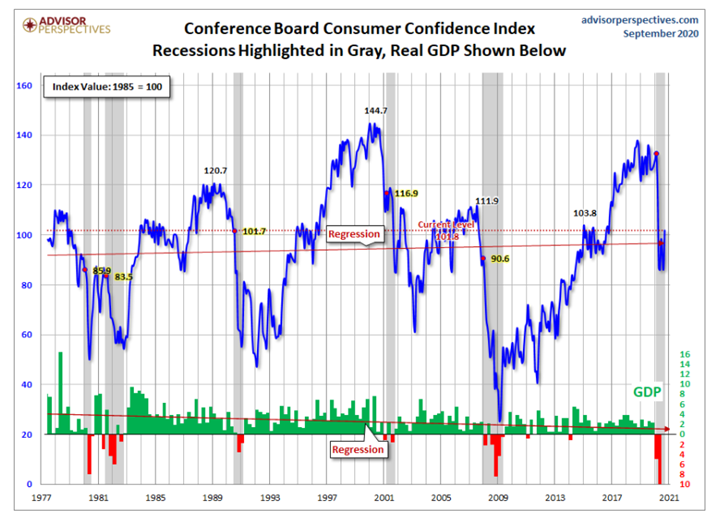
For the sake of comparison, here is a chart of the Conference Board’s Consumer Confidence Index (monthly update here). The Conference Board Index is the more volatile of the two, but the broad pattern and general trends have been remarkably similar to the Michigan Index, noted Mislinski of Advisor Perspectives.
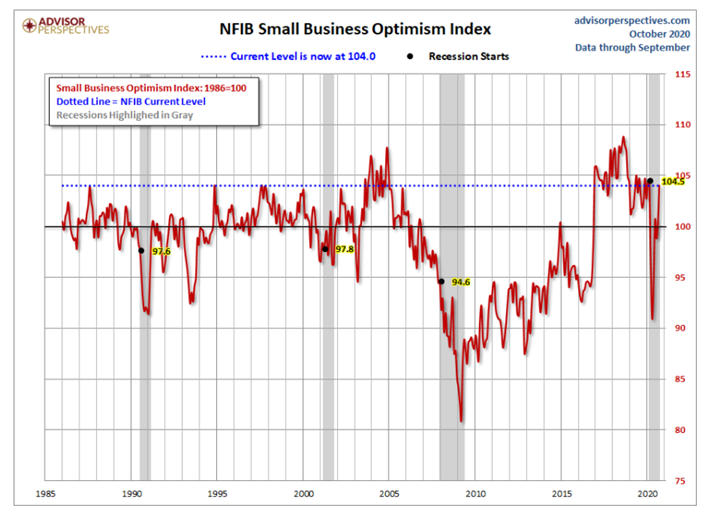
And finally, the prevailing mood of the Michigan survey also is similar to the mood of small business owners, as captured by the NFIB Business Optimism Index (monthly update here).
Consumers may be anxious about slowing “employment growth, the resurgence in COVID-19 infections and the absence of additional federal relief payments,” said Curtin. However, “Those concerns were largely offset by continued small gains in economic prospects for the year ahead.”
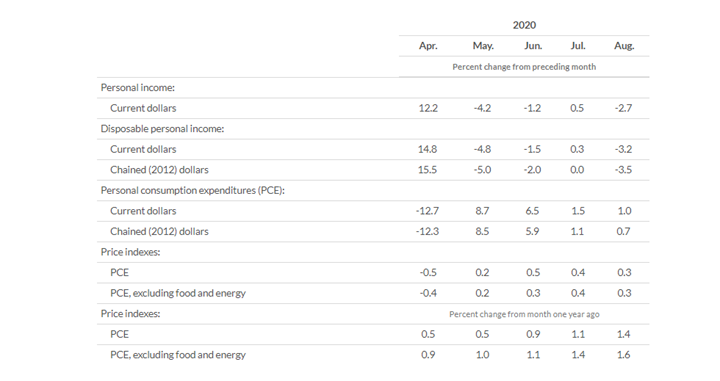
In August, the $86.1 billion increase in real personal consumption expenditures (PCE)— the value of the goods and services purchased by, or on the behalf of, U.S. residents—reflected an increase of $87.9 billion in spending for services that was partly offset by a $10.3 billion decrease in spending for goods, explained the Bureau of Economic Analysis.
“Within services, the leading contributors to the increase were spending for food services and accommodations as well as health care. Spending for food services and accommodations was based on Census Monthly Retail Trade Survey (MRTS) data and Smith Travel Research data. Within health care, both hospital and outpatient services increased, based on volume data for hospital services and outpatient visits as well as credit card data. Within goods, the leading contributor to the decrease was spending for food and beverages purchased for off-premises consumption, based on Census MRTS data,” according to the Bureau of Economic Analysis.
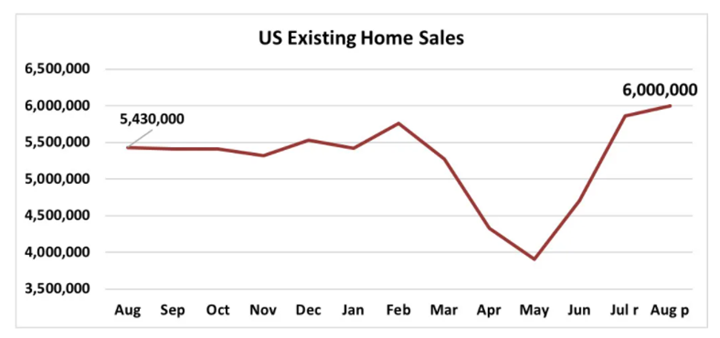
One such area of spending is a hot housing market. Activity rose 2.4% in August 2020 compared to the month prior. In fact, August’s existing-home sales reached a six million seasonally adjusted annual rate, with existing homes jumping 10.5% from August 2019, according to the National Association of Realtors.
Regionally, all four regions showed double-digit price growth from a year ago. The South had the largest gain of 12.3% followed by the West with an incline of 11.8%. The Midwest showed an increase of 10.7% and the Northeast had the smallest price gain of 10.4% from August 2019.
Moreover, Realtor.com said an active summer market is carrying over to a typically slower fall season. “Homes are being sold at an increasingly fast pace when compared to last year, and prices remain at all-time-highs in September,” the company stated. Additionally, inventory continues to be constrained by stronger than normal buyer demand and little new inventory.
- National inventory declined by 39.0% over last year.
- The inventory of newly listed properties declined by 13.8% nationally over the past year.
- The September national median listing price was $350,000, up 11.1% compared to last year.
- Nationally, the typical home spent 54 days on the market in September, 12 days less than the same time last year, and three days less than last month. This is the first time in our records that homes sold more quickly in September than August, and signals an unusually active fall market.
Retail sales also increased 1.9% in September (seasonally adjusted from August) and are up 5.4% year-over-year, according to the National Retail Federation (NRF).
For perspective, that is more than triple the 0.6% month-over-month increase and almost double the 2.8% year-over-year increase posted in August. Sales have been up both month-over-month and year-over-year since June, following record monthly drops this spring.
NRF’s calculation of retail sales, which excludes automobile dealers, gasoline stations and restaurants in order to focus on core retail, showed an increase of 1.3% (seasonally adjusted from August) and 12% unadjusted year-over-year growth during September.
“Consumers continue to prove their resilience and strength through this pandemic. Retailers and consumers are adapting to the current environment, embracing shopping in different ways and focusing on specific categories,” said Matthew Shay, NRF President and CEO.
In contrast to what The Conference Board reported, “Retail sales are continuing to build on the momentum we’ve seen through the summer and have been boosted by an improving labor market, a rebound in consumer confidence and elevated savings,” said Jack Kleinhenz, NRF chief economist.
With less spending on personal services such as travel and entertainment outside the home, the NRF says some of that money is shifting to retail cash registers. “All in all, these numbers and other economic data show the nation’s economy remains on its recovery path,” according to the company.
Important takeaways, courtesy of NRF
- Clothing and clothing accessory stores were up 11% month-over-month seasonally adjusted but down 12% unadjusted year-over-year.
- Sporting goods stores were up 5.7% month-over-month seasonally adjusted and up 18.3% unadjusted year-over-year.
- General merchandise stores were up 1.8% month-over-month seasonally adjusted and up 4.1% unadjusted year-over-year. Department stores, a subset of the category, were up 9.7% month-over-month.
- Health and personal care stores were up 1.7% month-over-month seasonally adjusted and up 7.8% unadjusted year-over-year.
- Building materials and garden supply stores were up 0.6% month-over-month seasonally adjusted and up 23.4% unadjusted year-over-year.
- Online and other non-store sales were up 0.5% month-over-month seasonally adjusted and up 27% unadjusted year-over-year.
- Furniture and home furnishings stores were up 0.5% month-over-month seasonally adjusted and up 7.5% unadjusted year-over-year.
- Grocery and beverage stores were unchanged month-over-month seasonally adjusted but up 11.5% unadjusted year-over-year.
- Electronics and appliance stores were down 1.6% month-over-month seasonally adjusted and down 6.1% unadjusted year-over-year.
Key Performance Indicators Report — October 2020


