KPI – October 2025: State of Business – Automotive Industry
Sponsored by Holley Performance Brands

- KPI – October 2025: The Brief
- KPI – October 2025: State of Manufacturing
- KPI – October 2025: Consumer Trends
- KPI – October 2025: State of the Economy
- KPI – October 2025: Recent Vehicle Recalls
Global Light Vehicle Sales
In September, the Global Light Vehicle (LV) selling rate remained “broadly in line” with the two prior months—holding at 94 million units per year. The market grew 7% year-over-year, as sales reached 8.1 million units globally. Approximately 67 million vehicles were sold year-to-date, up 5% from the same period in 2024.
Strategic markets like the U.S., Western Europe and China all experienced growth driven by various factors, according to GlobalData. A stateside surge was largely attributed to advanced EV purchases before the tax credit deadline, though non-EVs also performed well as manufacturers absorbed tariff costs—thus mitigating price increases. In Western Europe, countries like the UK, Spain and Germany posted year-over-year growth despite a tough year throughout the region. Likewise, ongoing government support and the lasting effects of the price war continued to drive strong EV sales in China.
“October global sales are expected to decrease 2.3% year-over-year. Although many regions are likely to see stable volumes or slight increases in year-over-year terms, declines in North America and the Commonwealth of Independent States (CIS) are expected to result in a modest global year-over-year decrease. Pressures on auto financing are constraining sales in Russia. The global selling rate is expected to reach 91.3 million units in October, down from a rate of 93.8 million units in October 2024,” according to David Oakley, manager of Americas vehicle sales forecasts at GlobalData.
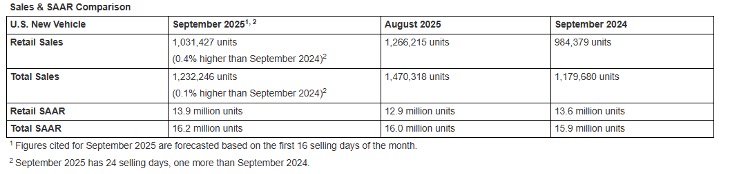
U.S. New Vehicle Market
Total new-vehicle sales for October 2025, including retail and non-retail transactions, are projected to reach 1,249,800 – a 6.9% year-over-year decrease, according to a joint forecast from J.D. Power and GlobalData.
“October’s results reflect a notable but expected decline in the new-vehicle sales pace due almost entirely to sales of electric vehicles,” says Thomas King, president of the data and analytics division at J.D. Power.
“Despite the sharp deterioration in EV sales, the decline could have been worse. Actions by multiple manufacturers to reduce EV prices and increase discounts to offset the loss of the federal credit are helping to maintain EV affordability, thereby preventing an even larger decline in EV sales,” he continues.
Key Takeaways, Courtesy of J.D. Power:
- Retail buyers are on pace to spend $46.1 billion on new vehicles, down $2 billion year-over-year.
- Internal combustion engine (ICE) vehicles are projected to account for 79.2% of new vehicle retail sales, an increase of 2.4 percentage points from a year ago. Plug-in hybrid vehicles (PHEV), electric vehicles (EVs) and hybrid electric vehicles make up 1%, 5.2% and 14.2%, with sales down 1.4 and 3.4 percentage points, respectively, and the latter up two percentage points year-over-year.
- Trucks/SUVs are on pace to account for 82.3% of new vehicle retail sales, up 1.3 percentage points from a year ago.
- Leasing is expected to account for 20.5% of sales this month, down 2.7 percentage points from a year ago.
- The average new vehicle retail transaction price in October is expected to reach $46,057, up $994 year-over-year.
- Average monthly finance payments are approximately $758, up $21 year-over-year. The average interest rate for new-vehicle loans is expected to be 6.56%, down 0.14 percentage points from a year ago.
- Total retailer profit per unit, which includes vehicle gross plus finance and insurance income, is expected to be $2,295, up $97 year-over-year and $137 from September 2025.
- Fleet sales are estimated to total 198,412 units in October, down 12.1% year-over-year. Fleet volume is expected to account for 15.9% of total light-vehicle sales, down 0.9 percentage points from a year ago.
“Looking ahead, the industry continues to navigate a complex mix of tariff-related cost pressures, challenging consumer affordability and EV-related disruption,” King says. “November traditionally marks the beginning of the holiday sales event season, a period that typically features elevated manufacturer-backed promotional activity, including enhanced leases. However, the number of leases set to expire in November and December are projected to be nearly 15% lower than the same period in 2024 and 48% lower than in 2023.”
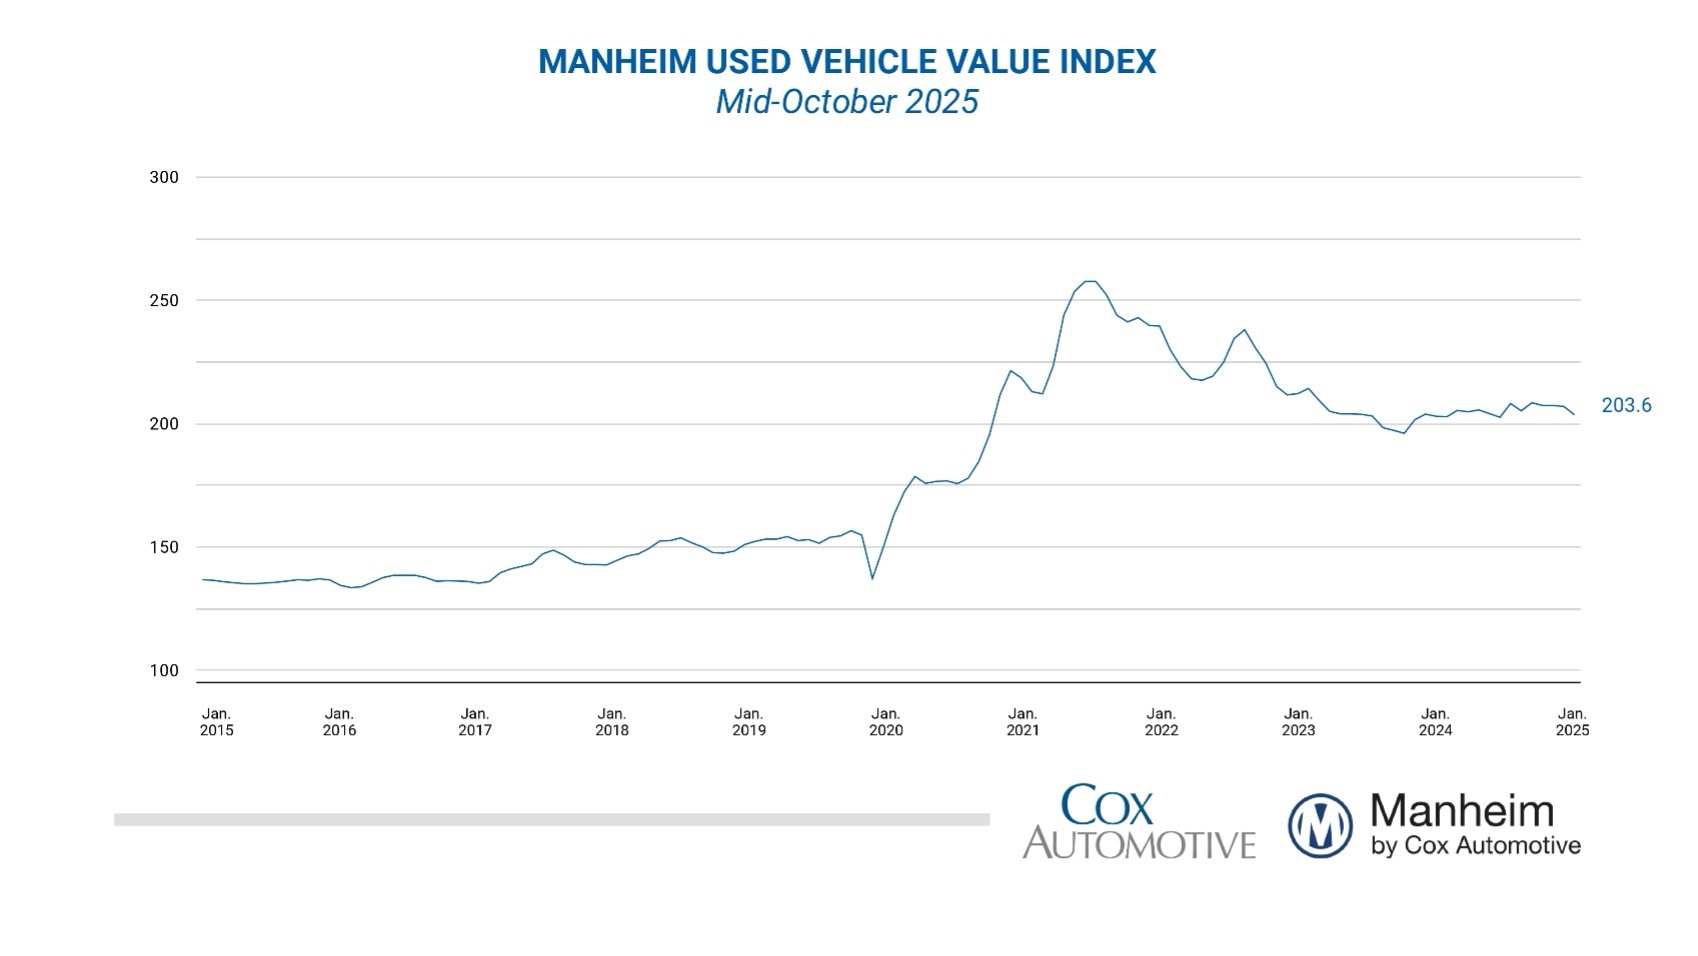
U.S. Used Market
Wholesale used-vehicle prices (on a mix-, mileage- and seasonally-adjusted basis) decreased from September during the first 15 days of October. The mid-month Manheim Used Vehicle Value Index fell to 203.6, posting a gain of 0.4% from the full month of October 2024.
“Wholesale values started to show weakness in late September and that has carried over into the first half of October, as price depreciation trends start to get back to normal levels,” says Jeremy Robb, deputy chief economist at Cox Automotive. “Declining retail sales in late September typically signal that we could see softer wholesale demand, a pattern holding at Manheim. While October typically shows the year’s strongest depreciation, current weekly declines are running higher than normal for this month, giving back some of the unusual price strength we maintained through most of 2025. The seasonal adjustment was smaller than typical for October, which amplified the month-over-month index decline.”
Segment results were mixed as it relates to seasonally adjusted, year-over-year prices. The luxury sector performed best, up 2.9%, followed by SUVs at 0.3%. The truck segment, midsize and compact cars declined 1.6%, 3.3% and 5%, respectively. Electric vehicles (EVs) showed the strongest year-over-year gains at 3.5%, while the non-EV segment increased by 0.3%.
On the contrary, the overall seasonally-adjusted prices fell 1.6% during the first 15 days of October compared to the full month of September. The compact car segment outperformed the overall market, up by 1.6%. Meanwhile, trucks, luxury, SUVs and midsize cars fell 1.2%, 1.4%, 1.9% and 2.3%, respectively. EVs “fell notably” month-over-month at 3.4%, while non-EVs were lower by 1.9% during the first half of the month.


