KPI — October 2023: Consumer Trends
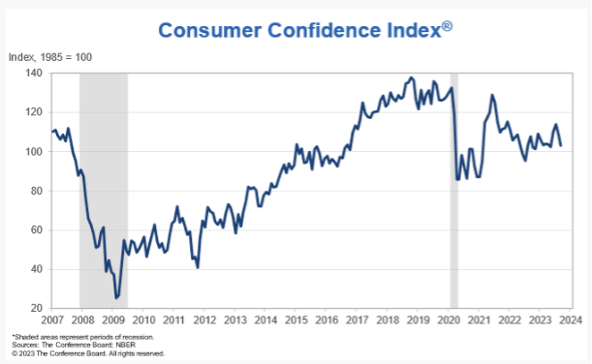
The Conference Board Consumer Confidence Index® declined to 103.0 (1985=100) in September, down from an upwardly revised 108.7 in August. The Present Situation Index – based on consumers’ assessment of current business and labor market conditions – rose slightly from 146.7 to 147.1 (1985=100). Meanwhile, the Expectations Index – based on consumers’ short-term outlook for income, business and labor market conditions – declined to 73.7 (1985=100), after falling to 83.3 in August.
Overall expectations dropped below 80 – a level which historically signals a recession within the next year. Accordingly, recent data also shows that consumer fears of an impending recession ticked up, which is consistent with the short and shallow economic contraction anticipated during the first half of 2024.
“September’s disappointing headline number reflected another decline in the Expectations Index,” says Dana Peterson, chief economist at The Conference Board. “Write-in responses showed that consumers continued to be preoccupied with rising prices in general, and for groceries and gasoline in particular. Consumers also expressed concerns about the political situation and higher interest rates.”
Peterson says the proportion of consumers saying a recession is “somewhat” or “very likely” rose in September after dropping in August.
According to recent data, the pullback in consumer confidence was evident across all age groups – most notably among consumers with household incomes of $50,000 or more. In addition, respondents expressed rising concerns about current family finances. Peterson says consumers may be hearing more bad news about corporate earnings, while job openings are narrowing, and interest rates continue to rise – making big-ticket items more expensive.
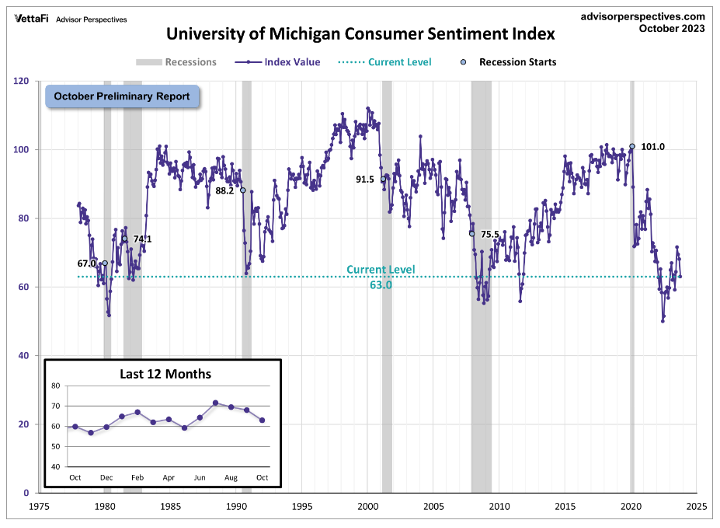
The chart evaluates the historical context for this index as a coincident indicator of the economy. Toward this end, Advisor Perspectives highlighted recessions and included GDP. To put today’s report into the larger historical context since its beginning in 1978, consumer sentiment is 25.9% below its average reading (arithmetic mean) of 85.0 and 24.9% below its geometric mean of 83.9. The current index level is at the 6th percentile of the 550 monthly data points in this series. This indicator is somewhat volatile, with a 3.1-point absolute average monthly change. The latest data point saw a 5.1-point decrease from the previous month.
Similarly, the University of Michigan Survey of Consumers – a survey consisting of approximately 50 core questions covering consumers’ assessments of their personal financial situation, buying attitudes and overall economic conditions – dipped to 68.1 in September, compared to 69.5 a month prior. Moreover, October preliminary data projects a sharp downward trend to 63.
Important Takeaways, Courtesy of Survey of Consumers:
- Assessments of personal finances declined approximately 15%, primarily driven by “a substantial increase” in concerns over inflation. Similarly, one-year expected business conditions plunged 19%.
- Nearly all demographics posted setbacks in sentiment, reflecting the continued weight of high prices.
- Despite challenges, year-ahead inflation expectations rose from 3.2% last month to 3.8% this month.
- Long-run inflation expectations also edged up from 2.8% last month to 3% this month, staying within the narrow 2.9-3.1% range for 25 of the last 27 months.
Consumer Income & Spending
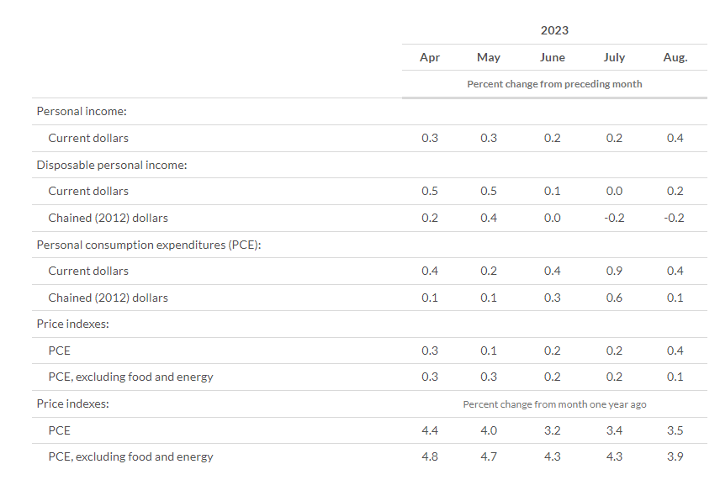
According to the U.S. Bureau of Economic Analysis (BEA), in August 2023 personal income increased $87.6 billion (0.4% at a monthly rate), while disposable personal income (DPI) – personal income less personal current taxes – increased $46.6 billion (0.2%) and personal consumption expenditures (PCE) increased $83.6 billion (0.4%).
In addition, personal outlays – the sum of PCE, personal interest payments and personal current transfer payments – increased $86 billion in August. Personal saving was $794.1 billion and the personal saving rate –personal saving as a percentage of disposable personal income – registered 3.9%.
Important Takeaways, Courtesy of BEA:
- In August, the $83.6 billion increase in current-dollar PCE reflected a $47 billion increase in spending for services and a $36.7 billion increase in spending for goods. Within services, the largest contributors to the increase were housing and utilities (led by housing), transportation services and health care (both hospitals and outpatient services). Within goods, the largest contributor to the increase was spending for gasoline and other energy goods (led by motor vehicle fuels, lubricants and fluids).
- The PCE price index in August increased 3.5%. Prices for goods increased 0.7%, while prices for services increased 4.9%. Food prices increased 3.1%, but energy prices decreased 3.6%. Excluding food and energy, the PCE price index increased 3.9% year-over-year.
Key Performance Indicators Report — October 2023


