KPI — October 2022: Consumer Trends

The Conference Board Consumer Confidence Index® increased in September for the second consecutive month. The Index now stands at 108.0 (1985=100), up from 103.6 in August. The Present Situation Index –based on consumers’ assessment of current business and labor market conditions – rose to 149.6 from 145.3 last month. The Expectations Index – based on consumers’ short-term outlook for income, business and labor market conditions – increased to 80.3 from 75.8.
The Present Situation Index rose again, after declining from April through July. The Expectations Index also improved from summer lows, but recession risks nonetheless persist, says Lynn Franco, senior director of economic indicators at The Conference Board.
Purchasing intentions were mixed: automobiles and big-ticket appliances were up, while home purchasing intentions fell. “The latter, no doubt, reflects rising mortgage rates and a cooling housing market,” Franco says. “Looking ahead, the improvement in confidence may bode well for consumer spending in the final months of 2022, but inflation and interest-rate hikes remain strong headwinds to growth in the short term.”
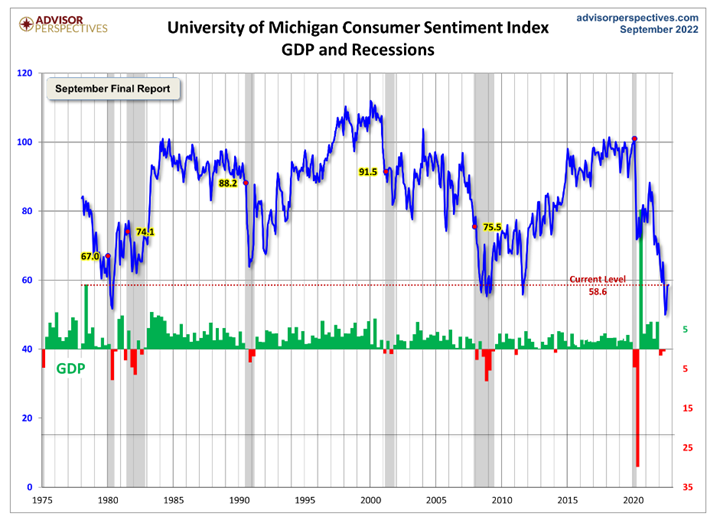
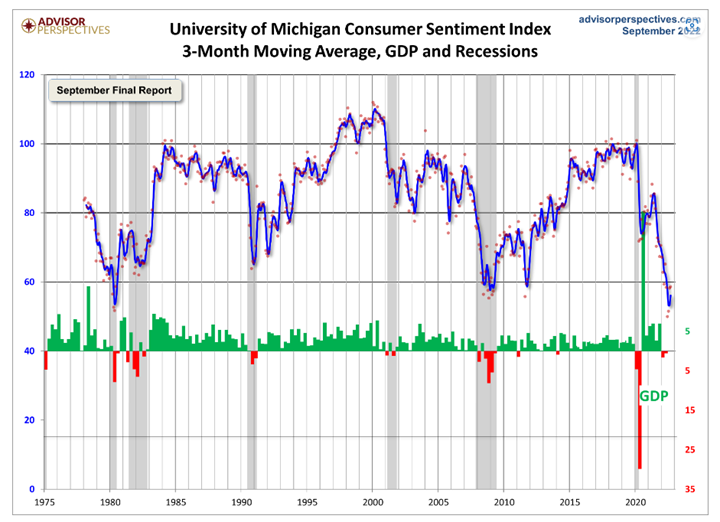
The chart evaluates the historical context for this index as a coincident indicator of the economy. Toward this end, Advisor Perspectives highlighted recessions and included GDP. To put the current report into larger historical context since its beginning in 1978, consumer sentiment is 31.5% below the average reading (arithmetic mean) and 30.7% below the geometric mean. The current index level is at the second percentile of the 537 monthly data points in this series. Note that this indicator is somewhat volatile, with a three-point absolute average monthly change. The latest data point saw a 0.4-point increase from the previous month.
The Consumer Sentiment Index – a survey consisting of approximately 50 core questions covering consumers’ assessments of their personal financial situation, buying attitudes and overall economic conditions – remained relatively unchanged at 58.6 in September but is down 19.5% year-over-year, according to the University of Michigan Survey of Consumers.
On the contrary, the Ipsos-Forbes Advisor U.S. Consumer Confidence Tracker showed a decrease of 2.2 points in its main index compared to a few weeks ago. The index dipped below the 50-point mark, where it was treading water from early June until mid-August.

Important Takeaways from Survey of Consumers:
- Buying conditions for durables and the one-year economic outlook continued lifting from the extremely low readings earlier in the summer, but these gains were largely offset by modest declines in the long run outlook for business conditions.
- The median expected year-ahead inflation rate edged down to 4.7%, the lowest reading since last September. At 2.7%, median long-run inflation expectations fell below the 2.9-3.1% range for the first time since July 2021. With consumer spending accounting for approximately 70 cents on every $1 dollar of economic activity, inflation could have detrimental impacts.
- Sentiment for consumers across the income distribution declined in a remarkably close fashion for the last six months, reflecting shared concerns over the impact of inflation – even among higher-income consumers who have historically generated “the lion’s share of spending.”
Consumer Income & Spending
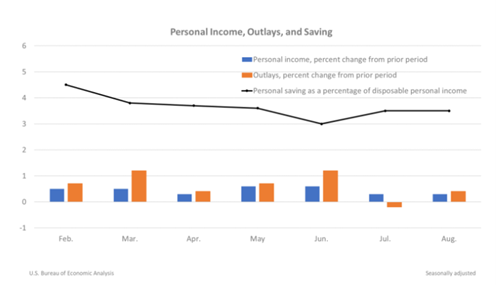
According to the U.S. Bureau of Economic Analysis (BEA), personal income increased $71.6 billion, or 0.3% at a monthly rate, while consumer spending increased $67.5 billion, or 0.4%, in August. The increase in personal income primarily reflected increases in compensation and proprietors’ income. The personal saving rate (that is, personal saving as a percentage of disposable personal income) was 3.5% in August, the same rate as in July.
Important Takeaways, Courtesy of BEA:
- Personal outlays increased, reflecting a bump in consumer spending for services which was partly offset by a decrease in consumer spending for goods.
- Within services, the largest contributors to the increase were housing and utilities (led by housing), transportation services and health care. Within goods, the primary contributor to the decrease was gasoline and other energy goods (led by motor vehicle fuels).
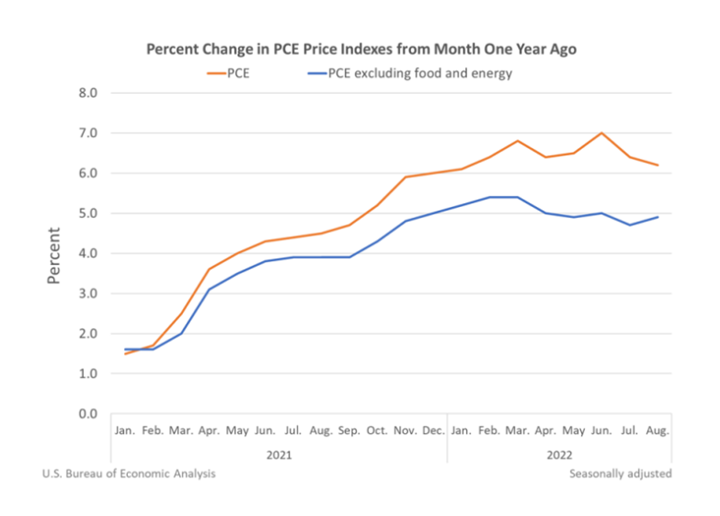
- The personal consumption expenditures (PCE) price index increased 6.2% year-over-year, reflecting increases in both goods and services. Meanwhile, energy prices increased 24.7% and food prices increased 12.4%. Excluding food and energy, the PCE price index for August increased 4.9% year-over-year.
Key Performance Indicators Report — October 2022
