KPI — November: New and Used Vehicle Sales
New Vehicle Sales
At the time of writing, total new vehicle sales were not finalized but are expected to improve for the sixth consecutive month in October. The SAAR is estimated to register 16.4 million, a small increase from September’s “surprisingly strong” 16.3 million rate, yet down from 16.8 million recorded a year prior, according to Cox Automotive.
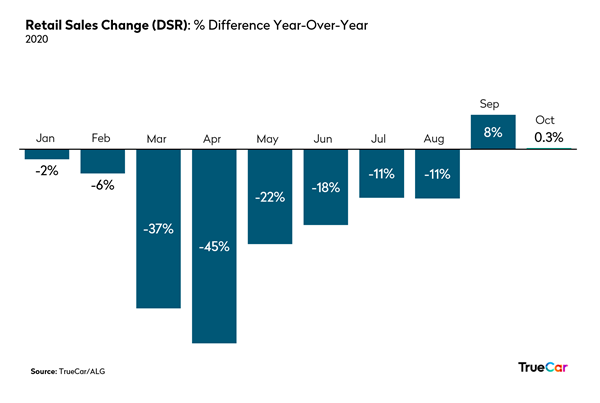
“The auto industry recovery is absolutely striking. We clawed back more new car sales each month since sales bottomed out in April and are now seeing year-over-year new car retail sales growth for two consecutive months. This is a phenomenal outcome for the industry, as inventory is starting to rebound and demand remains high. There are positive signals that the recovery will sustain,” said Eric Lyman, chief industry analyst for ALG.
In addition to “modest improvements in the U.S. economy,” including gains in consumer confidence and job creation, 2021 model year products “are keeping consumers interested in purchasing even during turbulent times,” affirmed Charlie Chesbrough, senior economist at Cox Automotive.
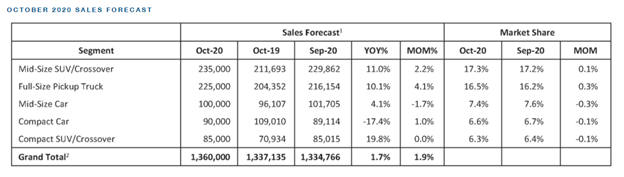
Important Takeaways, Courtesy of Cox Automotive:
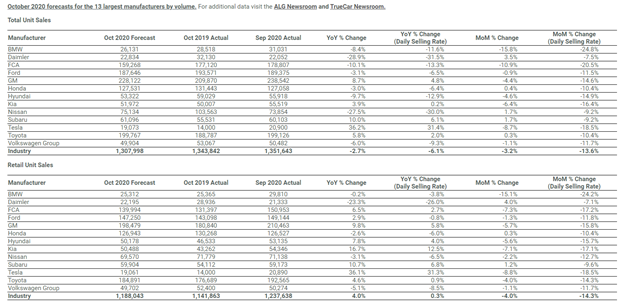
- New vehicle sales are forecast to hit 1.36 million units, up 1.7% compared to October 2019. When compared to last month, sales are expected to increase approximately 25,000 units or nearly 1.9%.
- Inventory remains one of the biggest challenges but is moderating, and sales have followed. Production should be less of a hurdle with factories operating close to pre-pandemic levels.
- The economic recovery is continuing to show modest improvements as well, so there is little reason to expect that the vehicle market will make a substantial change in its current recovery path during the upcoming months.
- The Cox Automotive full-year sales forecast has been updated to 14.3 million units, down 16% from 2019. New retail will perform better than fleet, with the former estimated to decline 9% and the latter at 1.9 million, down 42%.
- Many variables could impact sales, including a second wave of COVID-19, another dip in the economy, as well as a contested election.
Though two consecutive months of a boost in year-over-year retail sales demonstrates the remarkable strength of consumer demand. “The strong sales pace is occurring despite tight inventories. The combination of strong demand and lean inventories is enabling manufacturers to reduce new-vehicle incentives and is allowing retailers to reduce the discounts they typically offer on new vehicles,” said Thomas King, president of the data and analytics division at J.D. Power.
Important Takeaways, Courtesy of J.D. Power:
- The average incentive from manufacturers on new vehicles is on pace to be $3,678 per vehicle, a decrease of $425 from prior year and the second consecutive month below $4,000. Expressed as a percentage of the average vehicle MSRP, incentives for October are 8.7%, down 1.4 percentage points from a year ago—and the first time below 9% since June 2016. For context, incentive spending peaked at $4,953 per unit in April 2020. Retailers also continue to post significant growth in margins on new-vehicle sales. Total grosses per unit, inclusive of finance and insurance income, are on pace to reach $2,224, an increase of $829 from a year ago.
- Average transaction prices are expected reach another all-time high, rising 7.3% to $36,755. The shift toward more expensive trucks and SUVs remains a significant driver, with those two segments accounting for a combined 77% of retail sales compared to 73% a year prior. For context, the average transaction price five years ago (October 2015) was $30,921.
- Low interest rates and higher trade-in values are supporting higher transaction prices. The average interest rate for loans in October is expected to fall by 94 basis points from a year ago to 4.6%. Over the same time, the average monthly finance payment is up only $16 to $594. Concurrently, the average trade-in value has risen to $5,034, a year-over-year increase of $519, or 11.5%. Compared to a year ago, loan terms are relatively stable, with the average term up only one month to 70 months.
- The combination of elevated retail sales and average transaction prices means that consumers are expected to spend $43.7 billion on new vehicles, a record for the month of October. This represents an increase of $5.6 billion, or 14.6%, from October 2019.
Used Vehicle Sales
Like many (surprise) success stories during the pandemic, an unprecedented period of uncertainty and “existential crisis” presented a boom in the buying and selling of used vehicles, said Eric Rosenbaum, CNBC contributing writer.
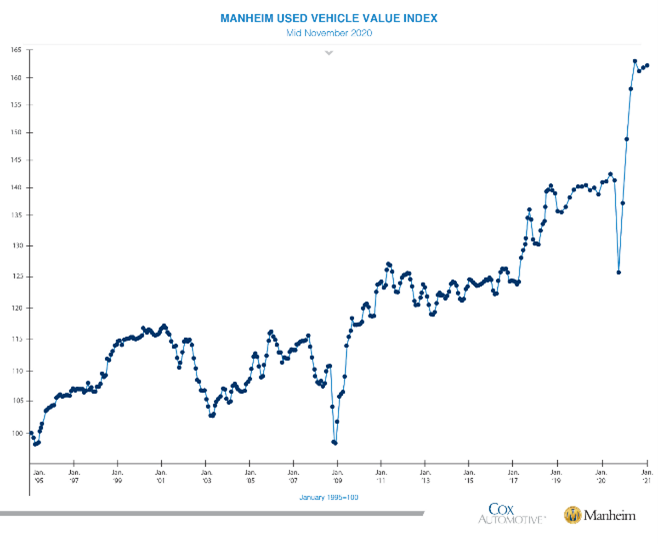
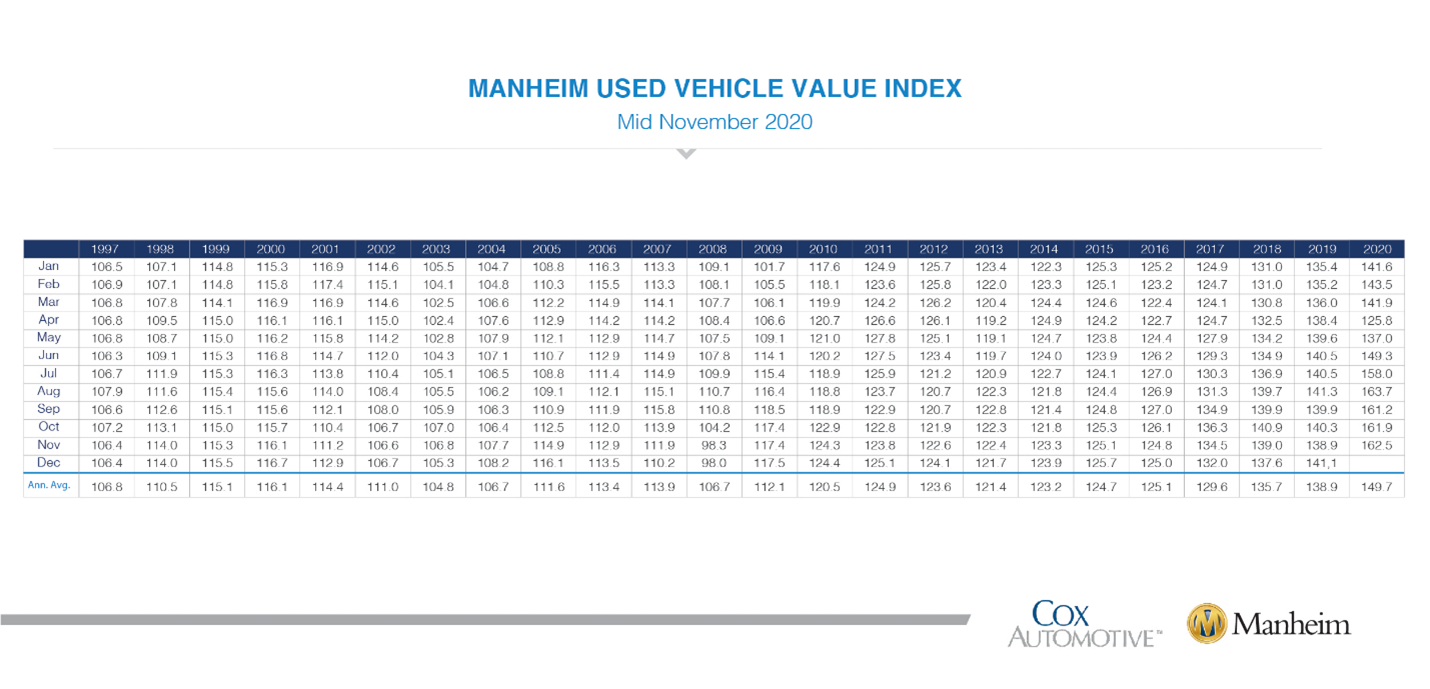
Again, wholesale used vehicle prices (on a mix, mileage and seasonally-adjusted basis) are on the rise, increasing 0.3% during the first 15 days of November compared to October. This brings the mid-month Manheim Used Vehicle Value Index to 162.5, a year-over-year increase of 16.9%.
“It should be noted that the non-seasonally adjusted monthly change was -0.9%, which was closer to what we have been seeing in weekly price trends,” affirmed Manheim. The company went on to explain how the difference between the two metrics is largely a result of the seasonal adjustment, which accounts for a decline in November. For example, across the full history of the Manheim Index, November has averaged a 0.6% monthly decline in the NSA price; however, over the last five years, that decline has been 1%, according to Manheim.
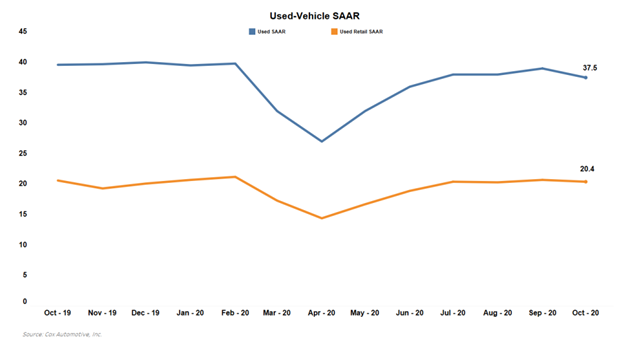
Additionally, Cox Automotive calculates a 13-month rolling used-vehicle seasonally adjusted annual rate (SAAR), yet another data point monitoring the health of the automotive market. According to estimates, total used vehicle sales volume was down 5% year-over-year in October. “We estimate the October used SAAR to be 37.5 million, down from 39.6 million last October and down compared to September’s 39.0 million rate,” said the company.
Likewise, the used retail SAAR goes a step further by only taking into account used vehicles sold via a dealership (both franchised and independent). Removing private party sales from the calculation, the October used retail SAAR estimate is 20.4 million—a small decline from 20.6 million last year and last month’s 20.7-million rate.
Furthermore, Manheim Market Report (MMR) prices declined on vehicles over the last two weeks. The Three-Year-Old MMR Index—representing the largest model year cohort at auction—experienced a 1.2% cumulative decrease. MMR Retention—the average difference in price relative to current MMR—averaged 99.6% over the first 15 days of November, but four days saw MMR Retention above 100%.
The sales conversion rate also appeared to bottom out the first week of November as it increased last week. Meanwhile, the key indicators suggest non-adjusted used vehicle values will see below-average declines in the days ahead, noted Manheim.
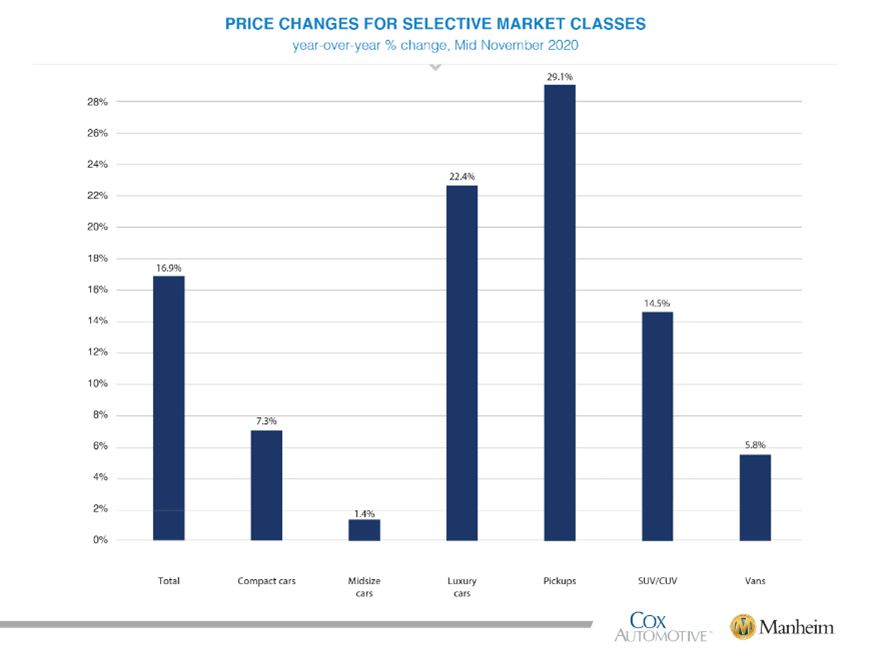
All major market segments had year-over-year seasonally adjusted price increases during the first 15 days of November. Luxury cars and pickup trucks outperformed the overall market, while most other major segments underperformed the overall market, according to recent reports.
Important Takeaways, Courtesy of Cox Automotive
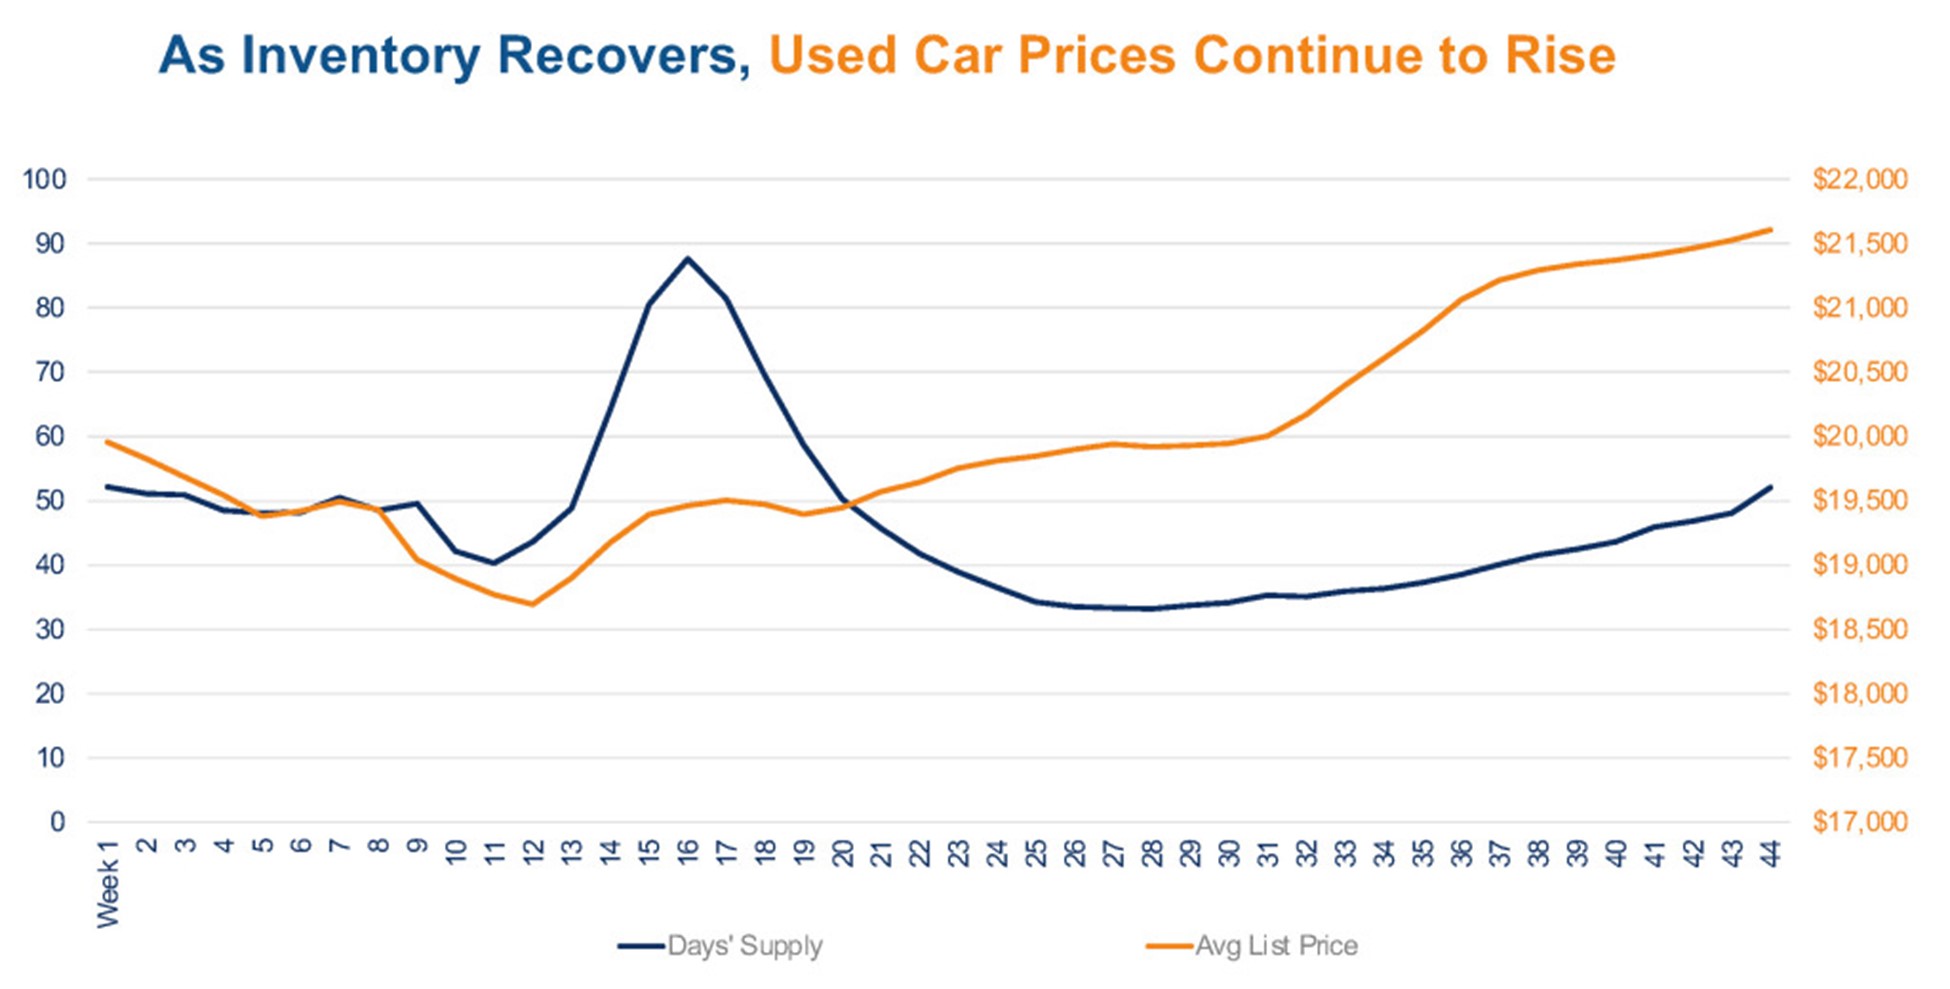
- Used-vehicle inventory, which had been rising modestly in recent weeks, accelerated more quickly to open the month of November, and the average listing price set a new record. As of November 2nd, the total U.S. supply of unsold used vehicles stood at 2.56 million, up from 2.35 million a month ago, but still down from three million in the same week a year ago. That put days’ supply entering November at 52, up from 42 a month ago. The large jump of the past week in days’ supply is mostly due to weakening sales. Data shows that sales for the 30 days leading up to this past week were the lowest they have been since early May. For the 30-day period, sales were down 18% from the same week last year and are down 28% from the late June sales peak.
- The average listing price of used vehicles set yet-another record at $21,607—up from $21,337 a month ago and $19,604 a year ago. For comparison, at the depth of the pandemic during the week of March 23, the average list price bottomed out at $18,681 but has been on the rise since then. “Used-vehicle supply is likely rising for a number of reasons,” said Charlie Chesbrough, senior economist at Cox Automotive. “Higher prices for used vehicles are likely slowing sales. Plus, more trade-ins from improving new-vehicle sales are coming into the market along with ongoing off-lease vehicles. The combination of all of those factors are causing days’ supply to rise,” he added.
- Data shows a distinct difference in inventory levels and prices between franchised dealers and independents. Franchised dealers had five days’ supply less than independents. Also, the average listing price was $4,000 more for franchised dealers.
KPI — November: Recent Vehicle Recalls
Key Performance Indicators Report — November 2020