- KPI – November 2025: State of Business – Automotive Industry
- KPI – November 2025: State of Manufacturing
- KPI – November 2025: State of the Economy
- KPI – November 2025: Consumer Trends
- KPI – November 2025: Recent Vehicle Recalls
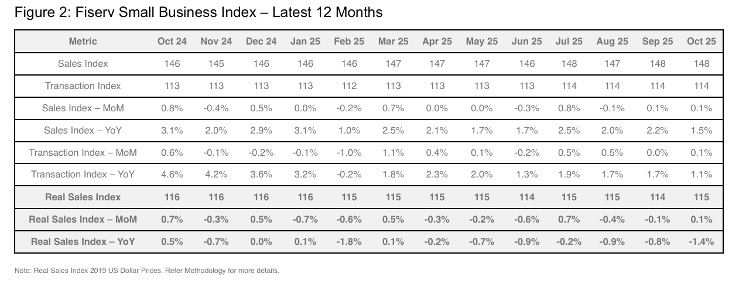
Nationally, the Fiserv Small Business Index “held steady” at 148 in October—reflecting 1.5% year-over-year growth, but only 0.1% month-over-month. The Fiserv Small Business Transaction Index posted similar results, increasing 1.1% year-over-year and 0.1% month-over-month as well. According to the report, early holiday-themed sales events likely provided a boost to some small business retail categories.
Key Takeaways, Courtesy of The Fiserv Small Business Sales Index:
- Small business retail sales edged up 0.7% month-over-month and 0.6% year-over-year. Core retail, which excludes volatile categories like gasoline stations, motor vehicle and parts dealers, as well as building materials, posted sales growth of 1.6% month-over-month and 2.6% year-over-year. Some of the more notable sales gains were in sporting goods (+3%) and clothing (+1.9%), two discretionary areas that may have benefited from the early holiday-themed sales activity driven by national retailers. Likewise, food and beverage sales were up 1.4% month-over-month, sustained by additional foot traffic and higher average tickets. Despite the bump, inflation-adjusted sales for October “tell a different story,” with a 0.3% and 2.3% year-over-year decline in core retail and total retail, respectively.
- Discretionary spending rose 0.2% year-over-year, with the essential category increasing at a faster pace of 2.5%. Inflation-adjusted discretionary sales were down 2.7% year-over-year, while essentials were down 0.4%.
- Overall, “restaurants continue to face headwinds,” with sales up merely 0.1% year-over-year and down 0.3% month-over-month.
While small business America is holding strong, the sector continues to feel the pressure. In October, the NFIB Small Business Optimism Index registered 98.2—down 0.6 points month-over-month but still above its 52-year average of 98. Meanwhile, the Uncertainty Index fell 12 points. At 88, it was the lowest reading of the year.
“Optimism among small businesses declined slightly in October as owners report lower sales and reduced profits. Additionally, many firms are still navigating a labor shortage and want to hire but are having difficulty doing so, with labor quality being the top issue for Main Street,” says Bill Dunkelberg, NFIB chief economist.
Important Takeaways, Courtesy of NFIB:
- Thirty-two percent (seasonally adjusted) of all owners reported job openings they could not fill in the current period, unchanged for the second consecutive month. Before August, the last time unfilled job openings hit 32% was in December 2020.
- Approximately 27% of small business owners cited labor quality as their single most important problem, up 9% from September and the highest level since the record high of 29% in November 2021. Labor quality ranked as the top problem and was 11% higher than taxes, which ranked second.
- A net negative 13% of all owners (seasonally adjusted) reported higher nominal sales in the past three months, down 6% from a month prior.
- The frequency of positive profit trends fell 9% to a net negative 25% (seasonally adjusted), which had the greatest impact on the Optimism Index decline.
- Both actual and planned price increases fell from the previous month. The net percent of owners raising average selling prices fell 3% to a net 21% (seasonally adjusted). Looking forward to the next three months, a net 30% (seasonally adjusted) plan to increase prices (down one point from September).
- The net percent of owners reporting inventory gains fell 3% to a net negative 6% (seasonally adjusted). Not seasonally adjusted, 10% reported increases in stocks (unchanged) and 15% reported reductions (up three points).
- Approximately 60% of small business owners reported supply chain disruptions were affecting their business to some degree, down 4% from September.
- The net percent of owners expecting better business conditions fell 3% to a net 20% (seasonally adjusted)—the lowest level since April but above the historical average of net 4%.
Professionals in the automotive, RV and powersports industries remain steadfast in their efforts to evolve their business models and grow their brands in the face of adversity. As such, the monthly Key Performance Indicator Report serves as an objective wellness check on the overall health of our nation, from the state of manufacturing and vehicle sales to current economic conditions and consumer trends. Below are a few key data points explained in further detail throughout the report.
Key Data Points:
- Economic activity in the manufacturing sector contracted in October for the eighth consecutive month, following a two-month expansion preceded by 26 straight months of contraction, say the nation’s supply executives in the latest ISM Manufacturing PMI Report. The Manufacturing PMI registered 48.7% in October, a 0.4% decrease compared to the reading of 49.1% recorded in September.
- In October, the Global Light Vehicle (LV) selling rate posted its second strongest month of the year at 96 million units per year. The market grew 3% year-over-year, as sales reached 8.2 million units globally. Approximately 75 million vehicles have been sold year-to-date—up 5% from the same period in 2024.
- Total new vehicle sales for November 2025, including retail and non-retail transactions, are projected to reach 1,255,900—a 5.2% decrease year-over-year, according to a joint forecast from J.D. Power and GlobalData.
- According to the quarterly forecast prepared by ITR Economics for the RV Industry Association (RVIA), RV wholesale shipments are projected to increase slightly by year-end to 337,000 units, then see continued growth to the mid-300,000 unit range in 2026.
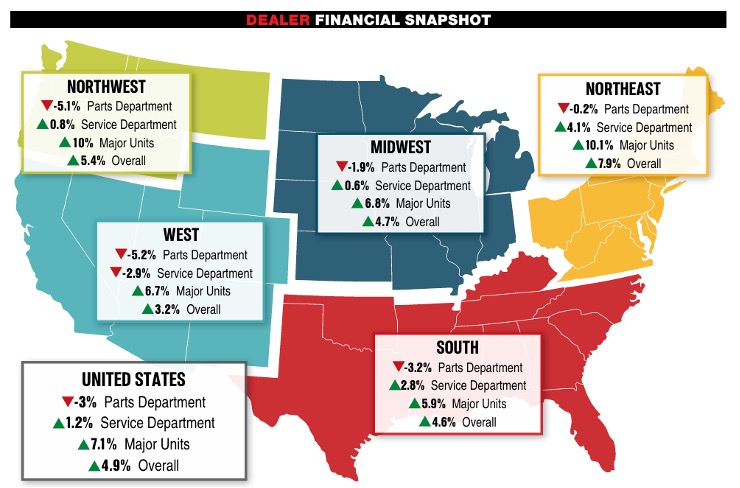
- Powersports Business says dealers across the country reported an overall combined revenue incline of 4.9% year-over-year in August, according to composite data from more than 1,700 dealerships in the U.S. that utilize CDK Lightspeed DMS. On average, dealerships were up 7.1% in major units and 1.2% in service, but down 0.3% in parts.