
KPI – November 2024: The Brief
KPI – November 2024: Recent Vehicle Recalls
KPI – November 2024: State of Business – Automotive Industry
KPI – November 2024: State of Manufacturing
KPI – November 2024: Consumer Trends
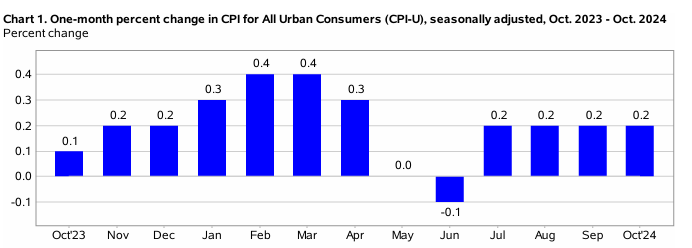
In October, the Consumer Price Index for All Urban Consumers (CPI-U) increased 0.2% on a seasonally adjusted basis, the same increase recorded during the past three months. Over the last 12 months, the all-items index increased 2.6% before seasonal adjustment.
Important takeaways, courtesy of the U.S. Bureau of Labor Statistics:
- The index for shelter rose 0.4% in October, accounting for over half of the monthly all-items increase. The food index also increased month-over-month, rising 0.2% as the food-at-home-index increased 0.1% and the food-away-from-home index rose 0.2%. The energy index was unchanged month-over-month, after declining 1.9% in September.
- Indexes on the rise include shelter, used cars and trucks, airline fares, medical care and recreation. The indexes for apparel, communication, as well as household furnishings and operations, decreased month-over-month.
The all-items index rose 2.6% for the 12 months ending October, after rising 2.4% last month. The all items less food and energy index rose 3.3%, while the food index increased 2.1% and the energy index decreased 4.9%.
While economic experts say inflation is “cooling,” consumers are still wrestling stubbornly high prices at the grocery store and gas pump. Click here for recent data detailing increases since November 2020.
A recent survey conducted by R.R. Donnelley & Sons Company (RRD) determined 88% of consumers express frustration with rising prices across multiple categories, including groceries, gas and restaurants. According to survey report details, price sensitivity continues to be a universal focus shared across all age groups and income levels, with 87% of baby boomers and 79% of households with $100,000-plus incomes expressing concern or frustration over food and beverage prices.
Survey data shows “consumers across key demographic groups have reached a breaking point,” and are shifting their shopping habits accordingly – prioritizing value over brand loyalty, favoring less expensive alternatives, hunting for bargains and avoiding products considered too costly.
“Consumers are becoming more judicious with their purchasing decisions, in large part due to the continued impact of external factors, including inflation,” says Beth Johnson, grocery industry expert and director of client strategy at RRD. “These factors are testing the loyalty of shoppers, making it more important than ever for marketers to rethink how they engage with buyers. Brands will need to meet shoppers where they are by emphasizing value and savings to hold their attention.”
EMPLOYMENT
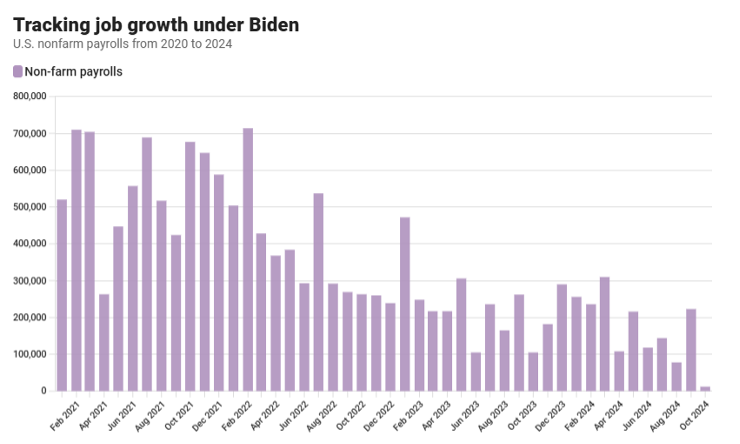
Total nonfarm payroll employment increased by 12,000 positions in October – well below economic predictions of 100,000-113,000 and the lowest tally since December 2020. The unemployment rate and number of unemployed persons were relatively unchanged at 4.1% and 7 million, respectively.
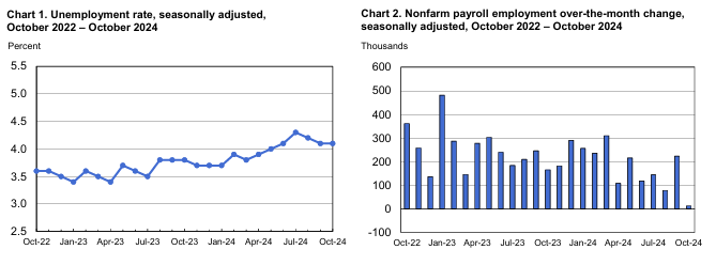
According to the U.S. Bureau of Labor Statistics, the labor force participation and long-term unemployed (those jobless for 27 weeks or more) rates were relatively unchanged at 62.6% and 22.9%, respectively. In addition, categories like discouraged workers and those holding part-time jobs for economic reasons were relatively unchanged month-over-month but remain high – the latter of which is up from 4.1 million to 4.6 million persons year-over-year.
Average hourly earnings for all employees on private nonfarm payrolls rose by 13 cents, or 0.4%, in October. Over the past 12 months, average hourly earnings have increased by 4%.
Regular monthly job revisions continue to be a troubling trend that industry professionals are monitoring closely. Throughout 2023, negative revisions within the monthly jobs report subtracted more than 440,000 jobs from the initial total. The concerning practice is consistent throughout 2024, as the Bureau revised its data by 57,000 in April, lowering its previous estimate of 165,000 jobs added to 108,000.
Likewise, May payroll estimates were revised down 54,000 jobs – decreasing total job gains from 272,000 to 218,000. That is a combined 111,000 fewer jobs in April and May than first reported, which brings the three-month average of job gains to roughly 177,000 – well below the 269,000 recorded during the first three months of the year.
Job creation in June was slashed by 61,000 (from a gain of 179,000 to 118,000), while July erased 25,000 (from a gain of 114,000 to 89,000). With the revision, July’s job creation was the lowest nonfarm payrolls reading since December2020.
Most recently, August and September fell victim to downward revisions. The former was revised down by 81,000 from a gain of 159,000 to 78,000, while the latter was revised down by 31,000 from a gain of 254,000 to 223,000.
“As expected, the October jobs report shows a big impact from Hurricanes Milton and Helene,” says Bill Adams, chief economist at Comerica Bank. “The big one-off shocks that struck the economy in October make it impossible to know whether the job market was changing direction in the month, but the downward revisions to job growth through September show it was cooling before these shocks struck.”
BY DEMOGRAPHIC
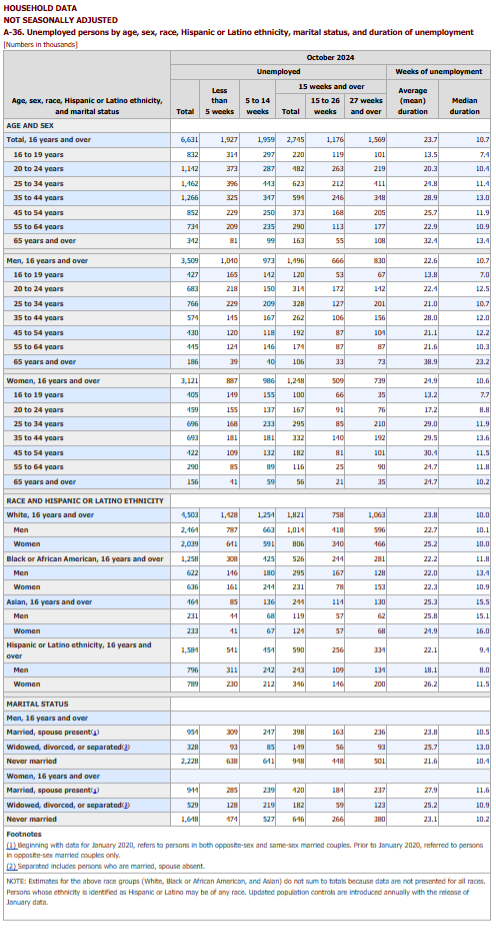
This month, unemployment rates among the major worker groups: adult women – 3.6%; adult men – 3.9%; teenagers – 13.8%; Asians – 3.9%; Whites – 3.8%; Hispanics – 5.1%; and Blacks – 5.7%.
Last month, unemployment rates among the major worker groups: adult women – 3.6%; adult men – 3.7%; teenagers – 14.3%; Asians – 4.1%; Whites – 3.6%; Hispanics – 5.1%; and Blacks – 5.7%.
Source: U.S. Bureau of Labor Statistics data.
BY INDUSTRY
The Conference Board Employment Trends Index (ETI) edged up to 107.66 in October, compared to a downwardly revised 107.58 in September.
“The ETI was nearly unchanged in October, holding steady at roughly 2018-19 levels, where it has persisted throughout the summer months,” says Mitchell Barnes, economist at the Conference Board. “The labor market continues to cool from its rapid post-pandemic pace, but the ETI suggests that this trend may be leveling out. This comes at a time when we expect business uncertainty to begin lifting, as the Federal Reserve’s rate cuts start taking hold and uncertainty around the U.S. election subsides.”
According to Barnes, economic data releases in October “underscored the resilience of the U.S. economy,” including in production, income and spending. He says Real Manufacturing and Trade Sales (an ETI component) improved and were up nearly 1.5% over the last three months compared to Q1 2024. Measures of output and productivity also remained strong year-over-year, including Industrial Production (an ETI component).
“Although October’s jobs report provided mixed results due to hurricane and strike impacts, several labor market indicators within the ETI improved,” Barnes adds. “We expect some of October’s data blips to reverse in subsequent months and generally see an economy growing at a healthy pace heading into 2025 as inflation and wage pressures continue to moderate.”
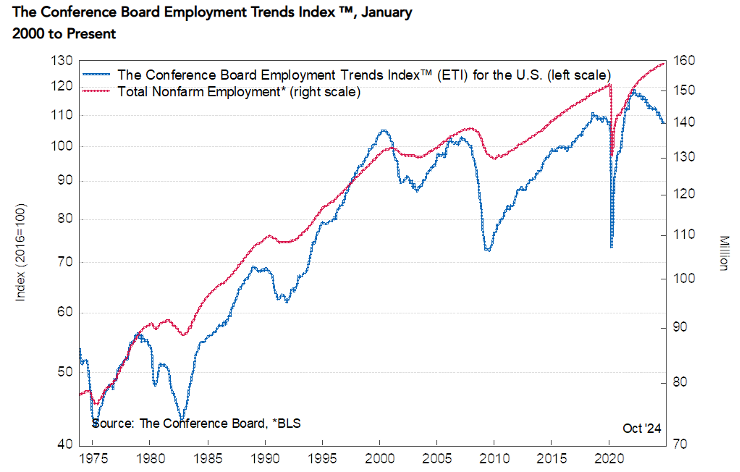
The Employment Trends Index is a leading composite index for payroll employment. When the Index increases, employment is likely to grow as well, and vice versa. Turning points in the Index indicate that a change in the trend of job gains or losses is about to occur in the coming months.
Important takeaways, courtesy of the U.S. Bureau of Labor Statistics:
- Healthcare added 52,000 jobs, in line with the average monthly gain of 58,000 over the prior 12 months. Employment rose in ambulatory health care services (+36,000) and nursing and residential care facilities (+9,000).
- Employment in government continued its upward trend (+40,000), similar to the average monthly gain of 43,000 over the prior 12 months. Employment continued to trend up in state government (+18,000).
- Within professional and business services, employment in temporary help services declined by 49,000. Temporary help services employment decreased by 577,000 since reaching a peak in March 2022.
- Manufacturing employment decreased by 46,000, reflecting a decline of 44,000 in transportation equipment manufacturing that was largely due to strike activity.
- Employment in construction changed little in October (+8,000). The industry added an average of 20,000 jobs per month over the prior 12 months. Non-residential specialty trade contractors added 14,000 jobs.
Click here to review more employment details.
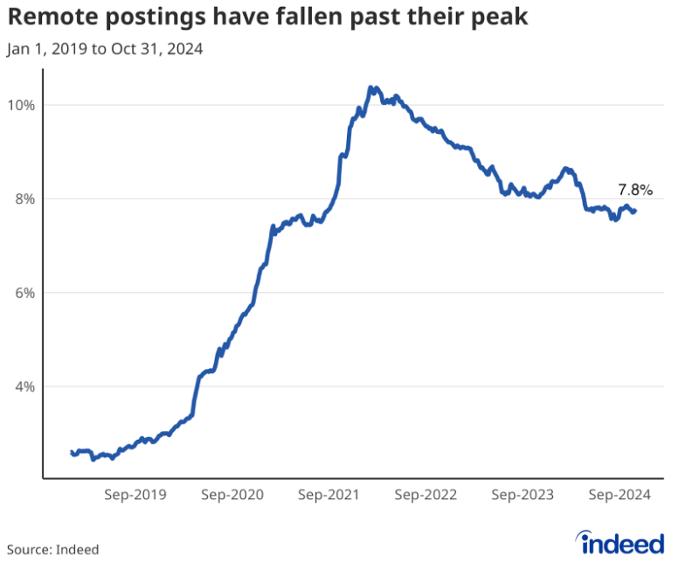
Caption and Image Source Credited to Indeed: A line graph titled “Remote postings have fallen past their peak” covers data from Jan. 1, 2019, to Oct. 31, 2024. With a vertical axis ranging from 0% to 10%, the graph shows the share of total postings that advertise a remote or hybrid position. Remote postings accounted for 2.6% of all postings in January 2019, peaked at 10.4% in February 2022, and decreased to 7.8% as of October 31, 2024.


