KPI — November 2022: Consumer Trends
The Conference Board Consumer Confidence Index® decreased in October, following back-to-back monthly gains. The Index now stands at 102.5 (1985=100), a sharp decline from 107.8 in September. The Present Situation Index – based on consumers’ assessment of current business and labor market conditions – nose-dived to 138.9, following a reading of 150.2 last month. The Expectations Index – based on consumers’ short-term outlook for income, business and labor market conditions – dipped to 78.1.
“The Present Situation Index fell sharply, suggesting economic growth slowed to start Q4. Consumers’ expectations regarding the short-term outlook remained dismal. The Expectations Index is still lingering below a reading of 80 – a level associated with recession – suggesting recession risks appear to be rising,” says Lynn Franco, senior director of economic indicators at The Conference Board.
Purchasing intentions were mixed: while plans to vacation cooled, intentions to purchase homes, automobiles and big-ticket appliances all increased.
“Looking ahead, inflationary pressures will continue to pose strong headwinds to consumer confidence and spending, which could result in a challenging holiday season for retailers,” Franco says. “And, given inventories are already in place, if demand falls short, it may result in steep discounting which would reduce retailers’ profit margins.”
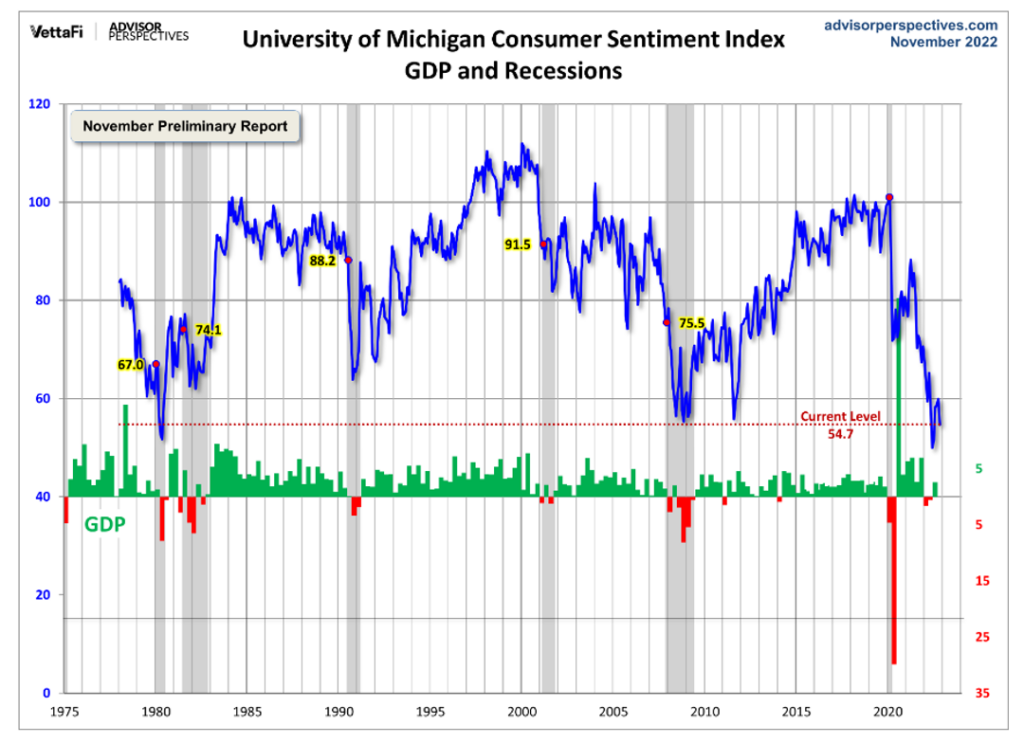
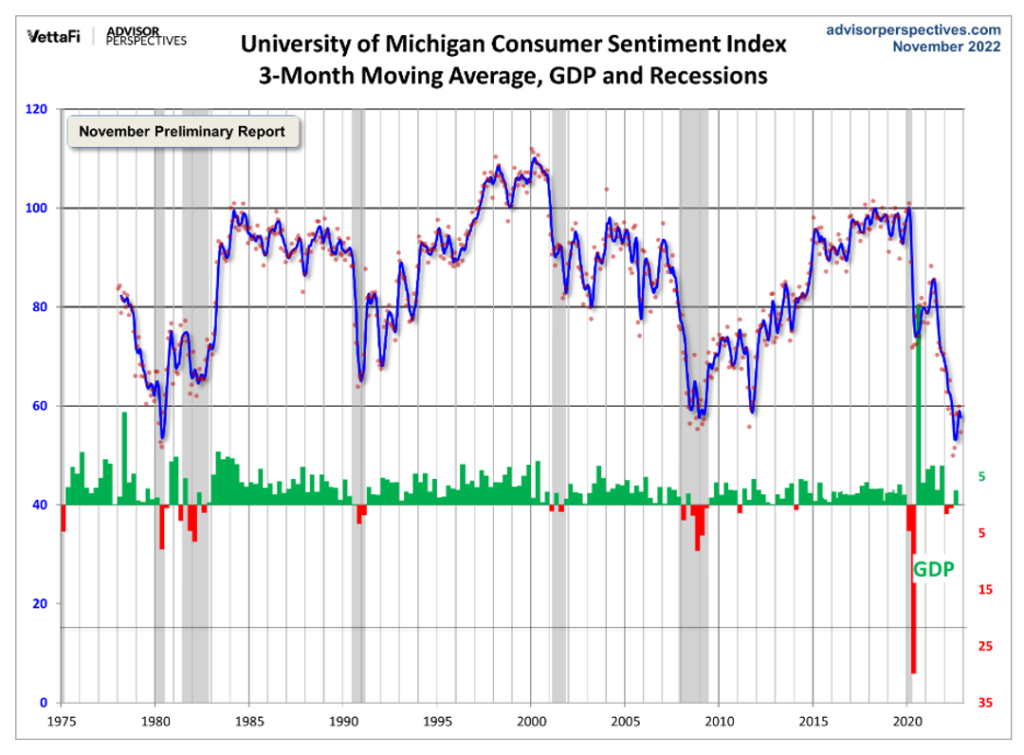
The chart evaluates the historical context for this index as a coincident indicator of the economy. Toward this end, Advisor Perspectives highlighted recessions and included GDP. To put the current report into larger historical context since its beginning in 1978, consumer sentiment is 36% below the average reading (arithmetic mean) and 35.2% below the geometric mean. The current index level is not quite at the 1st percentile of the 539 monthly data points in this series. Note this indicator is somewhat volatile, with a three-point absolute average monthly change. The latest data point saw a 5.2-point increase from the previous month.
The Consumer Sentiment Index November Preliminary Report – a survey consisting of approximately 50 core questions covering consumers’ assessments of their personal financial situation, buying attitudes and overall economic conditions – is currently 54.7, down 8.7% from the previous month’s reading and well below the initial estimate, according to the University of Michigan Survey of Consumers.
Important Takeaways from Survey of Consumers:
- All index components declined from last month; however, buying conditions for durables, which improved markedly last month, decreased sharply in November – falling back 21% on the basis of high interest rates as well as continued high prices.
- The median expected year-ahead inflation rate was 5.1%, up from 5% last month. Long run inflation expectations, currently at 3%, remain in the narrow (albeit elevated) 2.9-3.1% range.
- Coinciding with the consumer sentiment index, the current economic conditions index fell 11.9% to 57.8. The index of consumer expectations, which looks at where respondents see things heading in six months, tumbled 6.2% to 52.7.
Consumer Income & Spending
According to the U.S. Bureau of Economic Analysis (BEA), personal income increased $78.9 billion (0.4%) in September. Disposable personal income (DPI) increased $71.3 billion (0.4%) and personal consumption expenditures (PCE) increased $113.0 billion (0.6%).
The PCE price index increased 0.3%. Excluding food and energy, the PCE price index increased 0.5%, while real DPI increased less than 0.1% in September and Real PCE increased 0.3%. Goods increased 0.4% and services increased 0.3%.
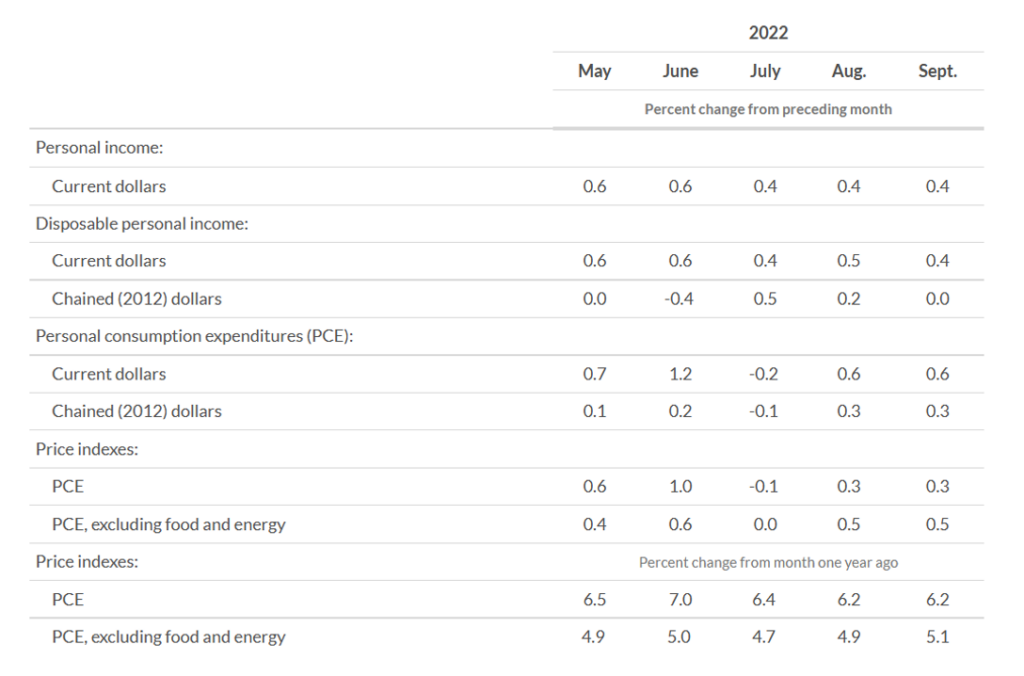
Important Takeaways, Courtesy of BEA:
- The $113 billion increase in current-dollar PCE in September reflected an increase of $94.7 billion in spending for services and an increase of $18.3 in spending for goods. Within services, the leading contributors were housing and utilities (mainly housing), “other” services (mainly international travel) and transportation services (mainly air transportation). Within goods, increases in “other” nondurable goods (mainly prescription drugs) and motor vehicles and parts (mainly new motor vehicles) were partly offset by a decrease in gasoline and other energy goods.
- Personal outlays increased $125.5 billion in September. Personal saving was $581.6 billion in September and the personal saving rate – personal saving as a percentage of disposable personal income – was 3.1%.
- The PCE price index for September rose 6.2% year-over-year. Prices for goods jumped 8.1% and prices for services increased 5.3%. Food prices climbed to 11.9% and energy prices increased 20.3%. Excluding food and energy, the PCE price index swelled 5.1% year-over-year.
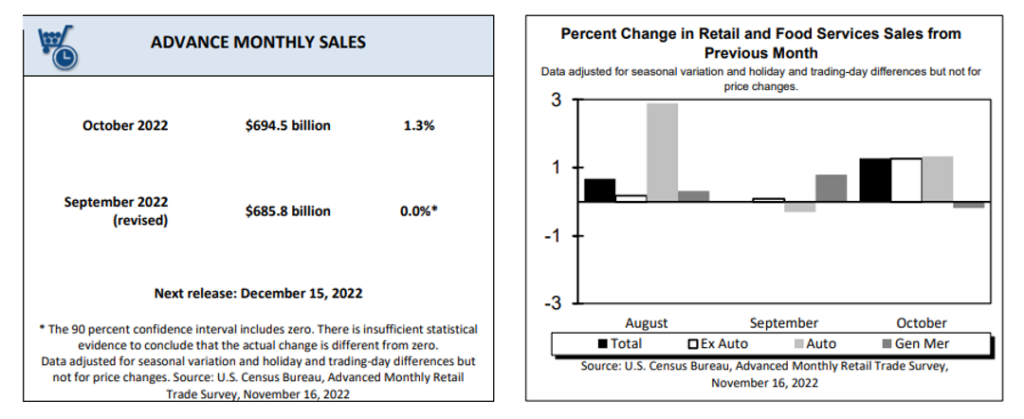
Advance estimates of U.S. retail and food services sales for October 2022 – adjusted for seasonal variation and holiday and trading-day differences but not for price changes – were $694.5 billion, up 1.3% (±0.5%) month-over-month, and 8.3% year-over-year. Total sales for the August 2022 through October 2022 period increased 8.9% (±0.5%) year-over-year, while the August 2022 to September 2022 percent change was unrevised from virtually unchanged (±0.2%)*. Retail trade sales were up 1.2% (±0.5%) from September 2022, and up 7.5% (±0.7%) above last year. Gasoline stations swelled 17.8% (±1.6%) year-over-year, while food services and drinking places were up 14.1% (±3.2%).
Key Performance Indicators Report — November 2022