KPI — May: The Voice of the Consumers

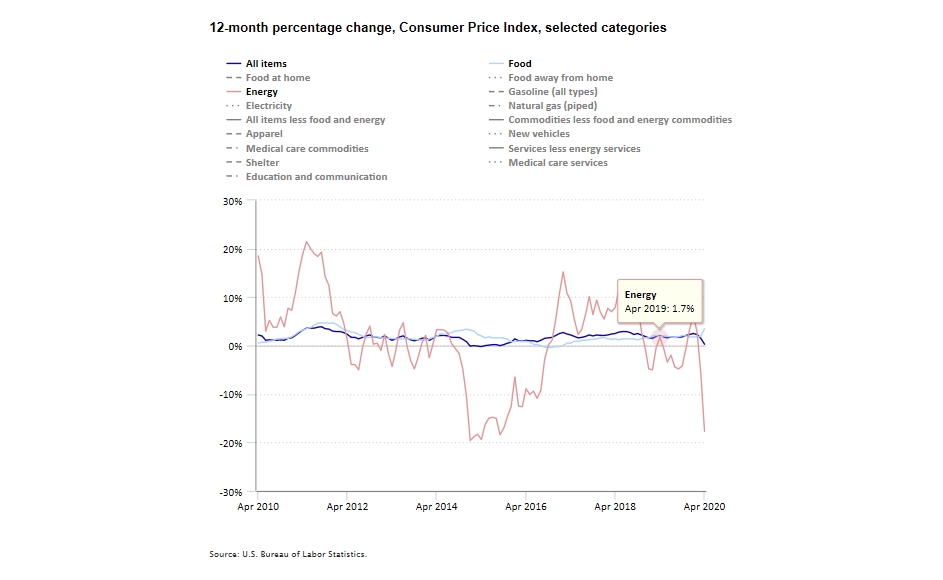
During April, the Consumer Price Index for All Urban Consumers (CPI-U) declined 0.8% on a seasonally adjusted basis, the largest monthly decline since December 2008, according to the U.S. Bureau of Labor Statistics. The all items index increased 0.3% before seasonal adjustment over the last 12 months, the smallest 12-month increase reported since October 2015.
Important takeaways from current reporting include the following, courtesy of the Bureau:
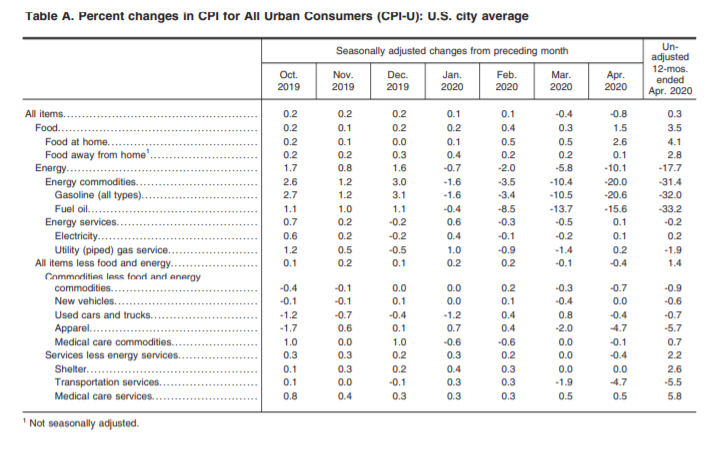
• A 20.6% decline in the gasoline index was the largest contributor to the monthly decrease in the seasonally adjusted all items index; however, the indexes for apparel, motor vehicle insurance, airline fares and lodging away from home all fell sharply as well.
• In contrast, food indexes rose, with the index for food at home posting its largest monthly increase since February 1974.
• The energy index declined mostly due to the decrease in the gasoline index, though some energy component indexes rose.
• The index for all items less food and energy fell 0.4%, the largest monthly decline in the history of the series, which dates to 1957.
• Along with the indexes mentioned above, the indexes for used cars and trucks and recreation also declined.
• The indexes for rent, owners’ equivalent rent, medical care, household furnishings and operations all increased.
• The index for all items less food and energy increased 1.4% over the last 12 months, its smallest increase since April 2011.
• The energy index fell 17.7% over the last year.
• In contrast, the food index rose 3.5% over the last 12 months, its largest 12-month increase since February 2012.
Below is a synopsis of relevant consumer-level details, including personal and disposable income, retail impact, consumer confidence and overall consumer sentiment.
Income, Consumer Spending and Retail Sales
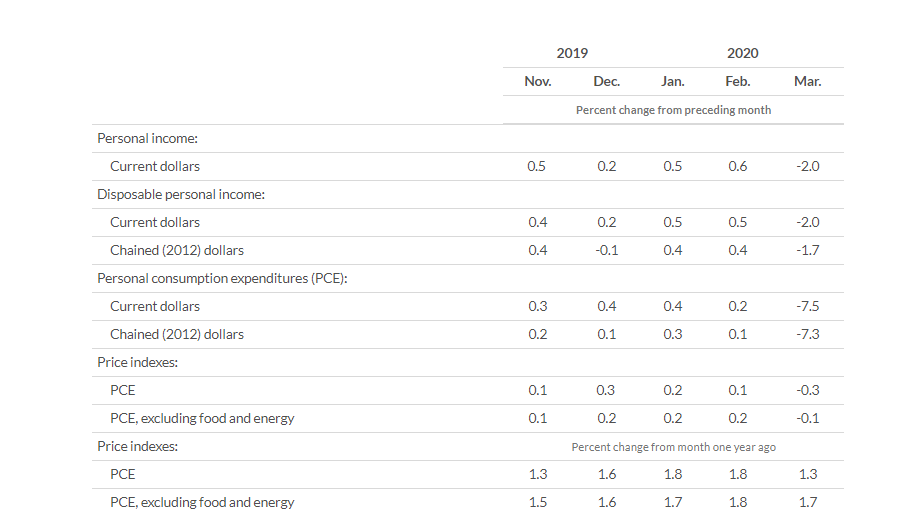
The pandemic and associated social distancing measures have led to a collapse in consumer spending and caused many businesses to reduce or cease operations and to lay off or furlough their employees, explained the Congressional Budget Office. Furthermore, the Bureau of Economic Analysis announced that personal income decreased $382.1 billion (2%), disposable personal income (DPI) decreased $334.6 billion (2%) and personal consumption expenditures (PCE) decreased $1,127.3 billion (7.5%).
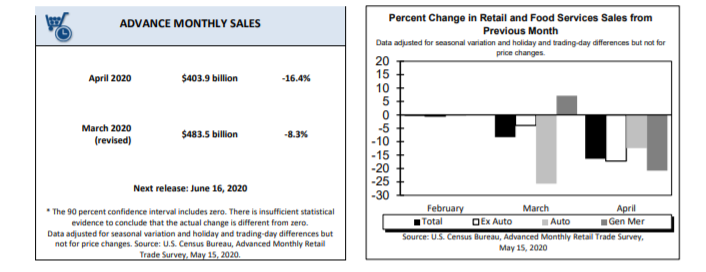
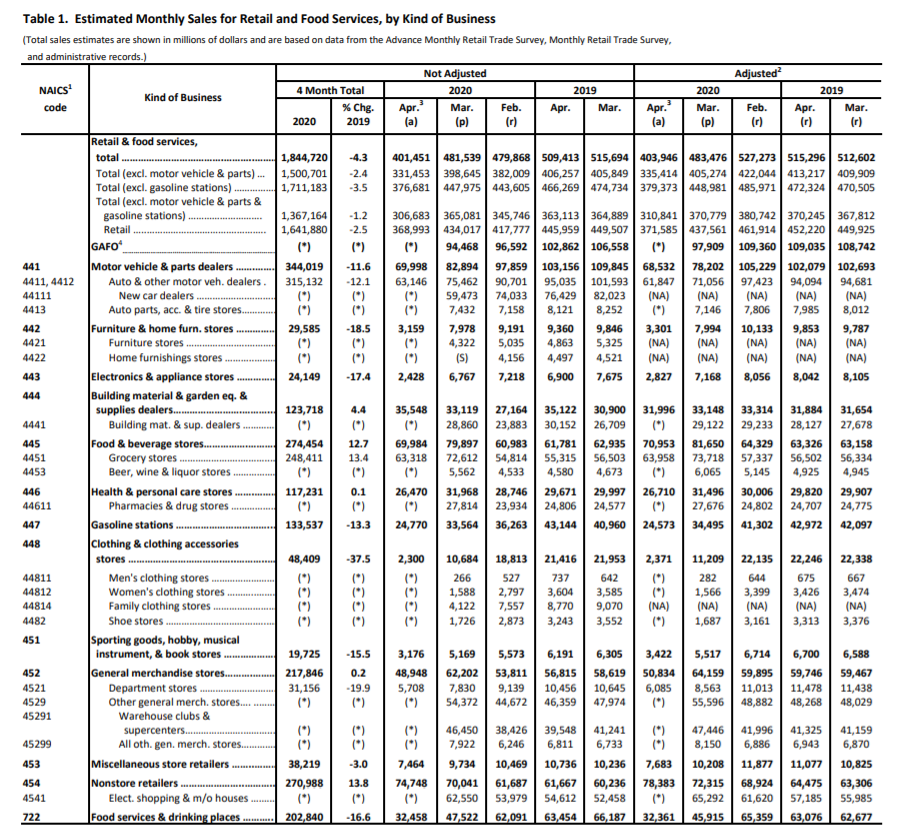
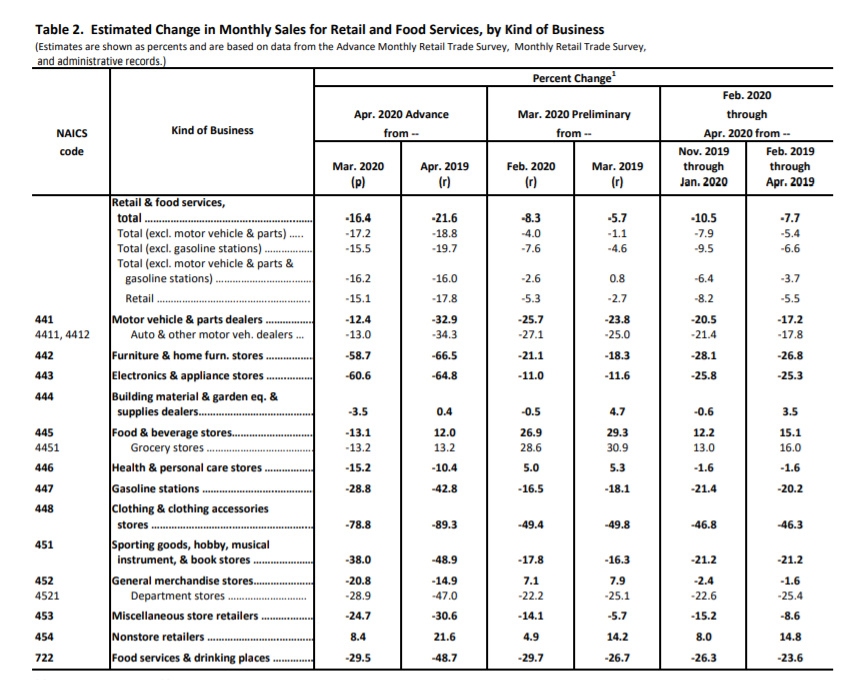
As a result, the U.S. Bureau of Labor and Statistics estimates U.S. retail and food services sales for April 2020, adjusted for seasonal variation and holiday and trading-day differences, but not for price changes, were $403.9 billion, a decrease of 16.4% (± 0.5%) from the previous month, and 21.6% (± 0.7%) below April 2019. Total sales for the February 2020 through April 2020 period were down 7.7% (± 0.5%) from the same period a year ago. The February 2020 to March 2020 percent change was revised from down 8.4% (± 0.4%) to down 8.3% (± 0.3%). Retail trade sales were down 15.1% (± 0.4%) from March 2020, and 17.8% (± 0.7%) below last year. Clothing and clothing accessories stores were down 89.3% (± 1.8%) from April 2019, while non-store retailers were up 21.6% (± 1.4%) from last year.
Americans remain skeptical but hopeful, as many governors begin to ease stay-at-home orders and implement safe, responsible protocols for reopening local economies crippled by the pandemic. Despite millions of Americans losing their jobs in recent weeks, The Conference Board Consumer Confidence Index® held steady in May, following a sharp decline in April.
“Following two months of rapid decline, the free-fall in Confidence stopped in May,” said Lynn Franco, senior director of economic indicators at The Conference Board. “The severe and widespread impact of COVID-19 has been mostly reflected in the Present Situation Index, which has plummeted nearly 100 points since the onset of the pandemic. Short-term expectations moderately increased as the gradual re-opening of the economy helped improve consumers’ spirits. However, consumers remain concerned about their financial prospects. In addition, inflation expectations continue to climb, which could lead to a sense of diminished purchasing power and curtail spending. While the decline in confidence appears to have stopped for the moment, the uneven path to recovery and potential second wave are likely to keep a cloud of uncertainty hanging over consumers’ heads,” she continued.
Important takeaways, courtesy of the Conference Board:
• Consumers’ assessment of current conditions declined further in May. The percentage of consumers claiming business conditions are “good” decreased from 19.9% to 16.3%, while those claiming business conditions are “bad” increased from 45.3% to 52.1%. Consumers’ appraisal of the job market was mixed. The percentage of consumers saying jobs are “plentiful” decreased from 18.8% to 17.4%, however those claiming jobs are “hard to get” decreased from 34.5% to 27.8%.
• Consumers, however, were moderately more optimistic about the short-term outlook. Those expecting business conditions will improve over the next six months increased from 39.8% to 43.3%, while those expecting business conditions will worsen decreased, from 25.1% to 21.4%.
• Consumers’ outlook for the labor market was mixed. The proportion expecting more jobs in the months ahead declined from 41.2% to 39.3%; however, those anticipating fewer jobs in the months ahead also decreased, from 21.2% to 20.2%. Regarding their short-term income prospects, the percentage of consumers expecting an increase declined from 17.2% to 14%, but the proportion expecting a decrease declined from 18.4% to 15%.
Consumer Sentiment
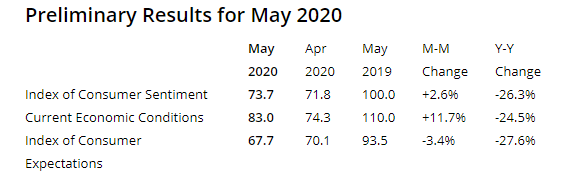
Preliminary data for May is at 73.7, a slight uptick from the April figure of 71.8. “Confidence inched upward in early May as the CARES relief checks improved consumers’ finances and widespread price discounting boosted their buying attitudes. Despite these gains, personal financial prospects for the year ahead continued to weaken, falling to the lowest level in almost six years, with declines especially sharp among upper income households. Improved views on buying conditions were due to discounted prices and low interest rates, although their impact was partially offset by uncertainties about job and income prospects. Perhaps the most surprising finding concerned consumers’ inflation expectations. The median expected inflation rate during the year ahead rose sharply, with wide differences across age and income subgroups,” explained Richard Curtin, chief economist for Surveys of Consumers.
Consumers were asked to identify their top concerns about the pandemic: threat to their health, the required social isolation or the impact on family finances? According to reporting, “The health threat dominated in both months, cited by 61% in April and 57% in May. The original hypothesis was that as their primary concerns shifted from health to finances, consumers would become less accepting of constraints on reopening the economy. Those that cited damages to their finances as their top concern fell to 17% in May from 22% in the prior month. Surprisingly, it was greater concerns about social isolation that increased, cited as the top concern by 21% in May up from 14% in April. While these shifts were quite small, they indicate the growing costs of social isolation and its potential to shift opinions about reopening the economy,” added Curtin.
Jill Mislinski of Advisor Perspectives, a leading interactive publisher for Registered Investment Advisors (RIAs), wealth managers and financial advisors, puts the report into a larger historical context—stating consumer sentiment is 14.6% below the average reading (arithmetic mean) and 13.6% below the geometric mean. The current index level is at the 20th percentile of the 509 monthly data points in this series. All information and charts below are courtesy of Advisor Perspective.
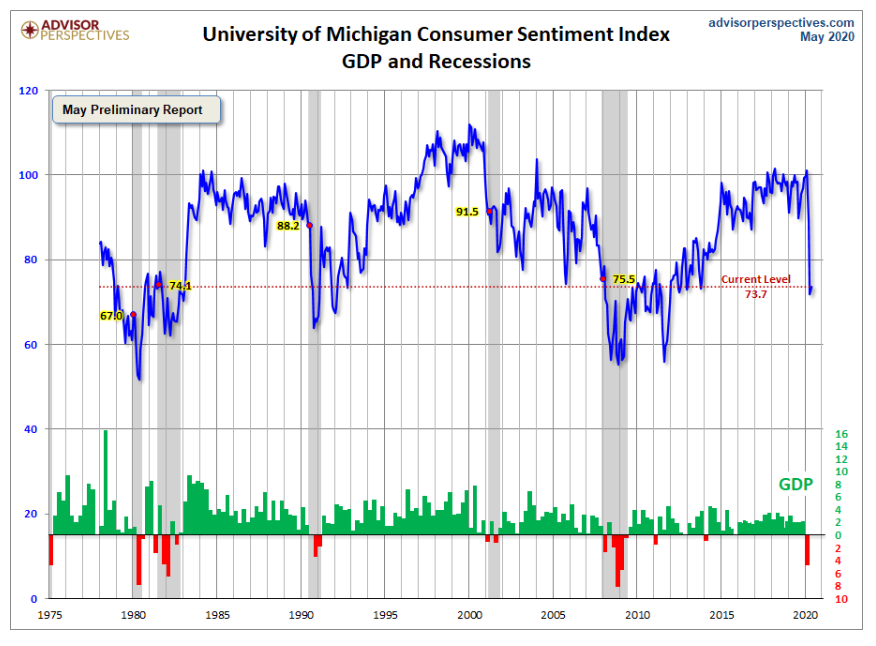
This chart displays a long-term perspective on this widely watched indicator. Recessions and real GDP are included to help evaluate the correlation between the Michigan Consumer Sentiment Index and the broader economy.
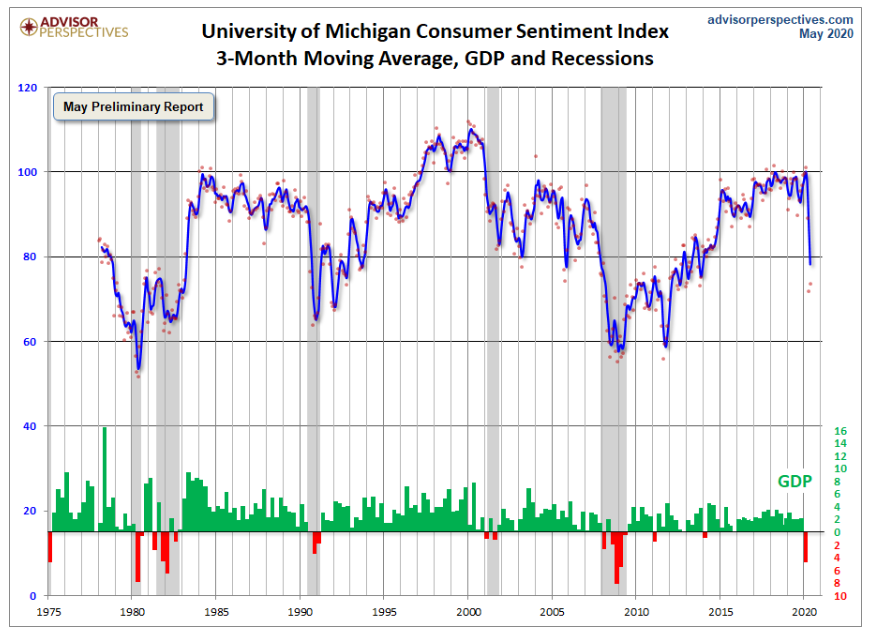
Note that this indicator is somewhat volatile, with a 3.0 point absolute average monthly change. The latest data point saw a 2.6-point decrease from the previous month. For a visual sense of the volatility, here is a chart with the monthly data and a three-month moving average.
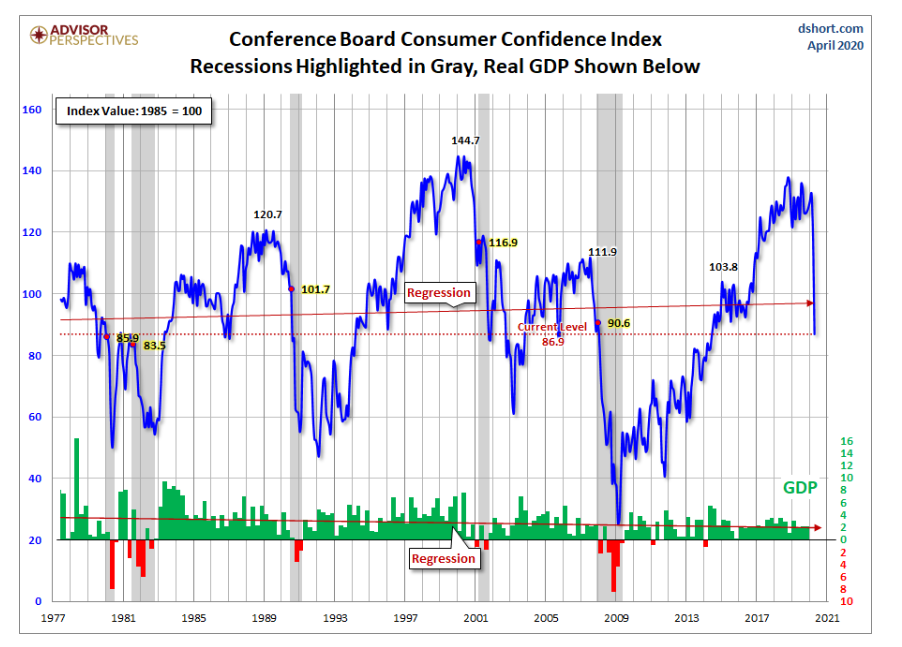
For the sake of comparison, here is a chart of the Conference Board’s Consumer Confidence Index. The Conference Board Index is the more volatile of the two, but the broad pattern and general trends have been remarkably similar to the Michigan Index.
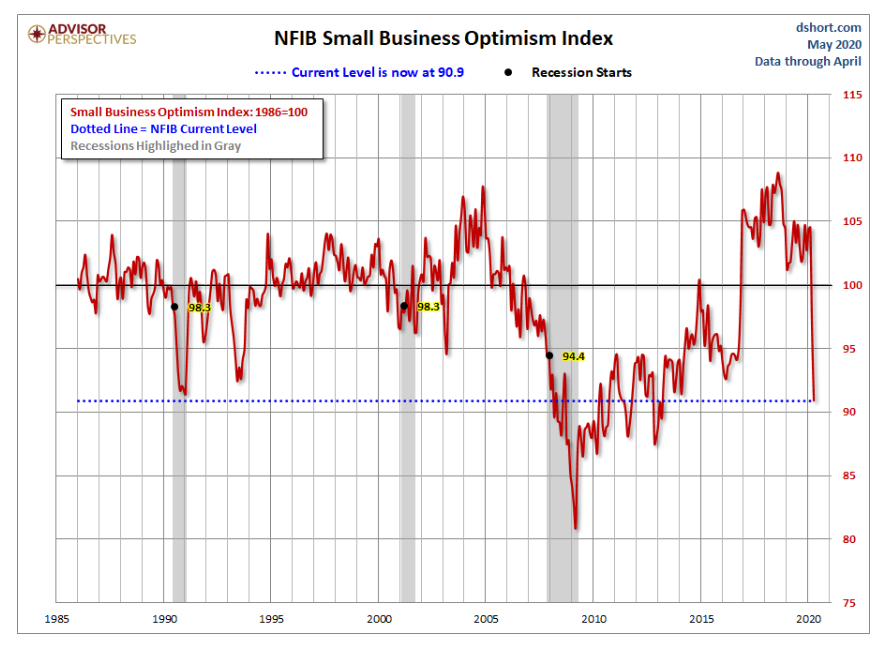
And finally, the prevailing mood of the Michigan survey is also similar to the mood of small business owners, as captured by the NFIB Business Optimism Index (monthly update here).
The general trend in the Michigan Sentiment Index after the Financial Crisis lows was one of slow improvement.


