KPI — May: State of the Manufacturing Sector

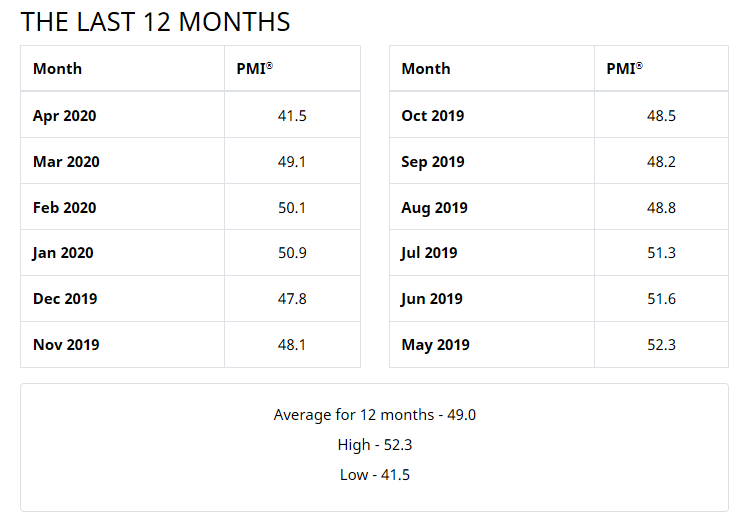
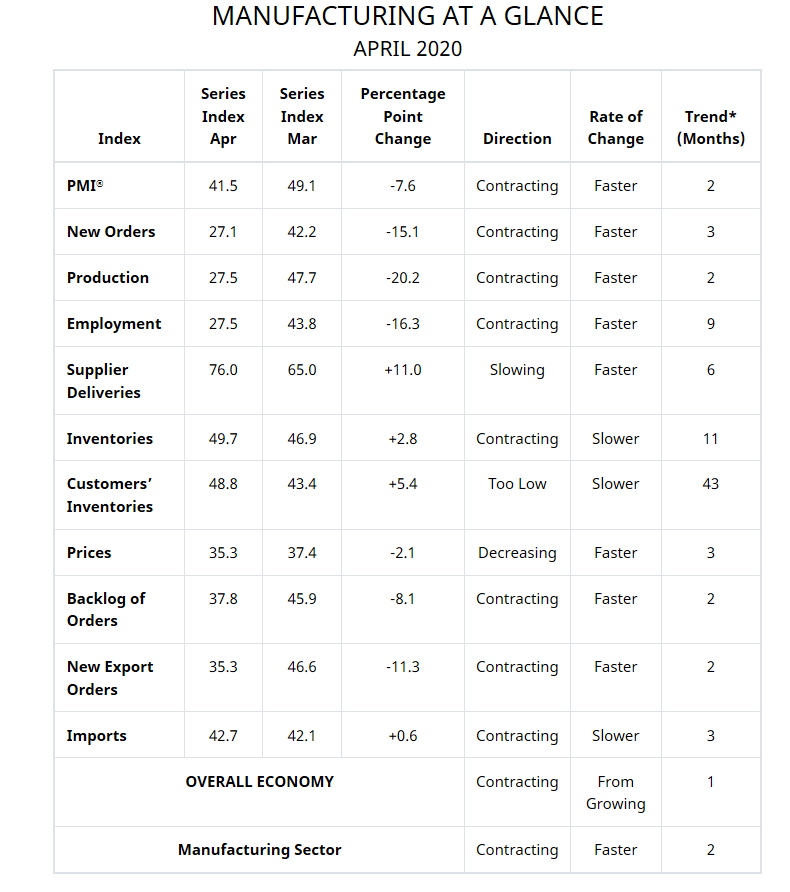
Economic activity in the manufacturing sector contracted in April, with the overall economy contracting after 131 consecutive months of expansion, say the nation’s supply executives in the latest Manufacturing ISM® Report On Business®. The April PMI® registered 41.5%, down 7.6 percentage points from the March reading of 49.1%.
The Report On Business® measures its data using the Purchasing Manager’s Index (PMI), which is an indicator of economic health in the manufacturing sector. A reading above 50% indicates that the manufacturing economy is generally expanding, while below 50% indicates that it is generally contracting.
“Comments from the panel were strongly negative (three negative comments for every one positive comment) regarding the near-term outlook, with sentiment clearly impacted by the coronavirus (COVID-19) pandemic and continuing energy market recession,” said Timothy R. Fiore, CPSM, C.P.M., Chair of the Institute for Supply Management® (ISM®) Manufacturing Business Survey Committee.
• The PMI® indicates a level of manufacturing-sector contraction not seen since April 2009, with a strongly negative trajectory. Demand contracted heavily, with the (1) New Orders Index contracting at a very strong level, again pushed by new export order contraction, (2) Customers’ Inventories Index approaching a level that is considered a negative for future production, and (3) Backlog of Orders Index strongly contracting, in spite of a lack of production during the period.
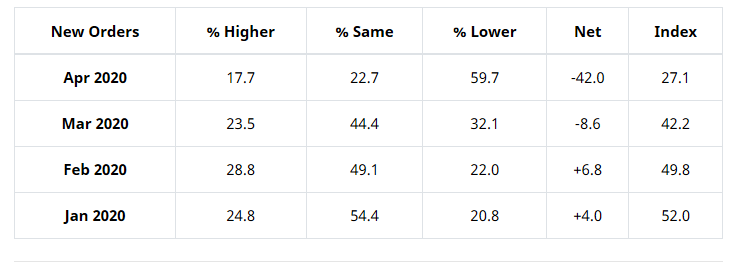
ISM®’s New Orders Index was 27.1% in April, a decrease of 15.1 percentage points compared to the 42.2% reported during March. This indicates that new orders contracted for the third consecutive month. It is the index’s lowest reading since December 2008, when it registered 25.9%.
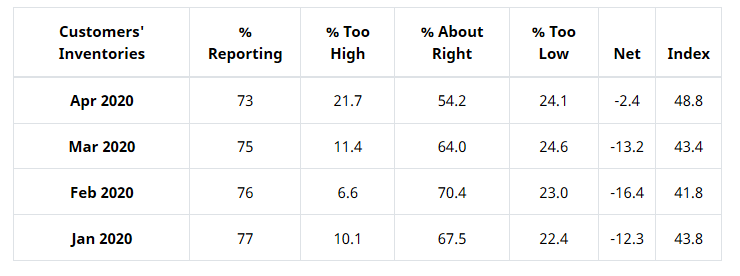
ISM®’s Customers’ Inventories Index was 48.8% in April, 5.4 percentage points higher than the 43.4% reported during March, indicating that customers’ inventory levels were considered too low.
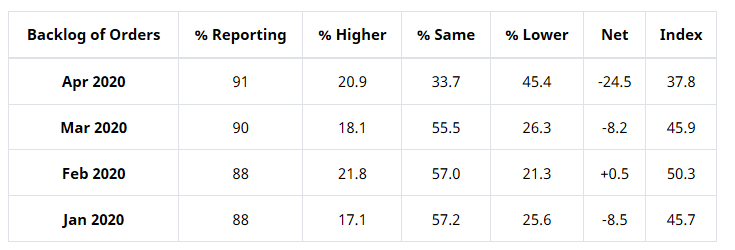
ISM®’s Backlog of Orders Index was 37.8% in April, an 8.1-percentage point decrease compared to the 45.9% reported in March, which indicates order backlogs contracted for the second consecutive month. This is the index’s lowest reading since March 2009 (37.6%).
• Consumption (measured by the Production and Employment indexes) contributed negatively (a combined 36.5-percentage point decrease) to the PMI® calculation, with activity dramatically contracting due to plant closures and lack of demand.
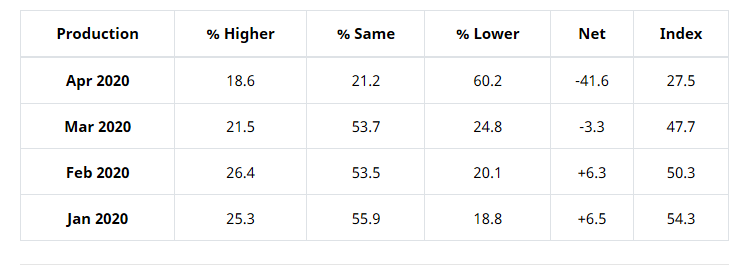
The Production Index was 27.5% in April, the lowest figure since numeric ISM® Report On Business® index records began in January 1948. The index indicated a second straight month of contraction, and the 20.2-percentage point decrease from the March reading of 47.7% is the largest one-month decline since January 1984, when the index fell 20.7 percentage points.
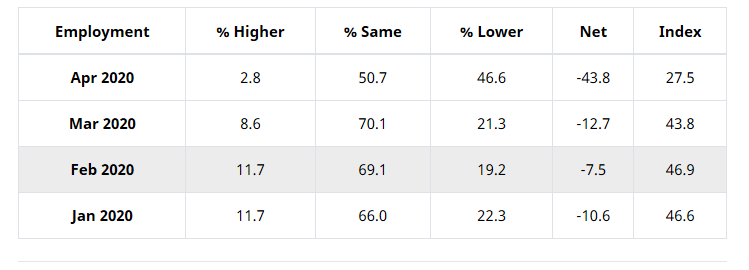
ISM®’s Employment Index was 27.5% in April, 16.3 percentage points lower than the March reading of 43.8%. This is the index’s lowest reading since June 1949 (27.2%) and largest one-month percentage-point decrease since numeric records began in January 1948. “This is the ninth month of employment contraction, and at a much faster rate compared to March. All six big industry sectors experienced employment contraction as a result of furloughs and layoffs due to a lack of new orders and/or social-distancing mandates,” added Fiore.
• Inputs — expressed as supplier deliveries, inventories and imports — strengthened again due to supplier delivery issues that were partially offset by continuing imports sluggishness. The delivery issues were the result of disruptions in domestic and global supply chains, driven primarily by supplier plant shutdowns. Inventory contraction slowed due to throughput issues. Inputs contributed positively (a combined 13.8-percentage point increase) to the PMI® calculation. (The Supplier Deliveries and Inventories indexes directly factor into the PMI®; the Imports Index does not.) Prices continued to contract (and at a faster rate in April), supporting a negative outlook.
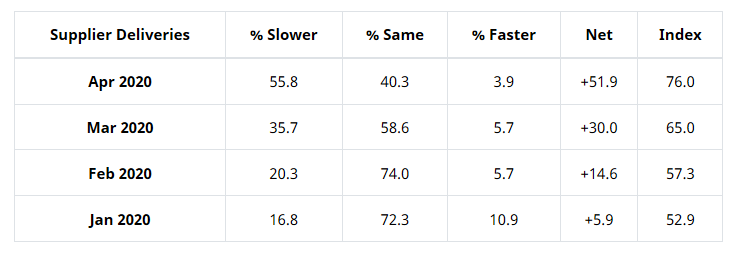
The delivery performance of suppliers to manufacturing organizations was slower in April, as the Supplier Deliveries Index registered 76%. This is 11 percentage points higher than the 65% reported in March. The index reached its highest level since April 1974, when it registered 82.1%.
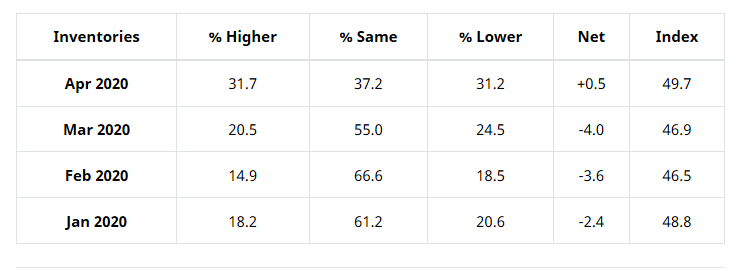
The Inventories Index registered 49.7% in April, 2.8 percentage points higher than the 46.9% reported for March.
“The coronavirus pandemic and global energy market weakness continue to impact all manufacturing sectors for the second straight month. Among the six big industry sectors, Food, Beverage & Tobacco Products remains the strongest. Transportation Equipment and Fabricated Metal Products are the weakest of the big six sectors,” said Fiore.
Of the 18 manufacturing industries, Paper Products and Food, Beverage & Tobacco Products reported growth. The 15 industries reporting contraction during April include Printing & Related Support Activities; Furniture & Related Products; Transportation Equipment; Textile Mills; Fabricated Metal Products; Nonmetallic Mineral Products; Machinery; Plastics & Rubber Products; Electrical Equipment, Appliances & Components; Petroleum & Coal Products; Wood Products; Miscellaneous Manufacturing; Computer & Electronic Products; Primary Metals; and Chemical Products.
• Commodities Up in Price: Caustic Soda; Disinfectants & Soaps; Freight; Personal Protective Equipment (PPE); PPE—Gloves (2); PPE—Masks; and Precious Metals.
• Commodities Down in Price: Aluminum (3); Copper (3); Corn; Crude Oil (3); Diesel Fuel (2); Distillates; Gasoline; Natural Gas (5); Scrap (3); Steel—Hot Rolled (3); Steel—Stainless; and Steel Products.
• Commodities in Short Supply: Capacitors; Disinfectants & Soaps; Electrical Cable; Hand Sanitizer (2); Isopropyl Alcohol (2); N95 Masks; PPE—Gloves (2); PPE—Masks (2); and Resistors.
Note: The number of consecutive months the commodity is listed is indicated after each item.
What Industry Professionals Are Saying
• “Thirty-percent decrease for April due to COVID-19 impact on both customers and suppliers.” (Computer & Electronic Products)
• “Production stopped, other than to make hand sanitizer for those in need.” (Chemical Products)
• “COVID-19 has created a wave of activities, including vendors closing, vendors focusing only on the medical industry, employees not coming to work, delayed shipments from overseas [and] etcetera.” (Transportation Equipment)
• “The food processing B2B space remains steady. We are weathering the storm. There is a fortunate increased need for packaged foods. Softening is showing through in some products that find their way into food service and lodging.” (Food, Beverage & Tobacco Products)
• “Our refinery is losing money making gasoline due to the falling demand.” (Petroleum & Coal Products)
• “We supply the construction industry in various ways, where the slowdown has been a bit slower than most industries. It is, however; beginning to impact our business, and we see more challenges on the horizon.” (Fabricated Metal Products)
• “The company I work for manufactures personal protective equipment [PPE], specifically N95 masks, face shields, as well as selling protective clothing and hand protection. In the area of PPE, our backlog has spiked to numbers we have never seen. While no doubt some of the backorders will be canceled, many of the orders are longer term commitments from [the] U.S. government.” (Apparel, Leather & Allied Products)
• “Our packaging business is starting to see signs of a slowdown in May after two strong months into COVID-19.” (Paper Products)
• “COVID-19 has destroyed our market and our company. Without a full recovery very soon, and some assistance, I fear for our ability to continue operations.” (Nonmetallic Mineral Products)
• “Dealing with the effects of coronavirus and having 65% of our operations down.” (Furniture & Related Products)
New Export Orders*
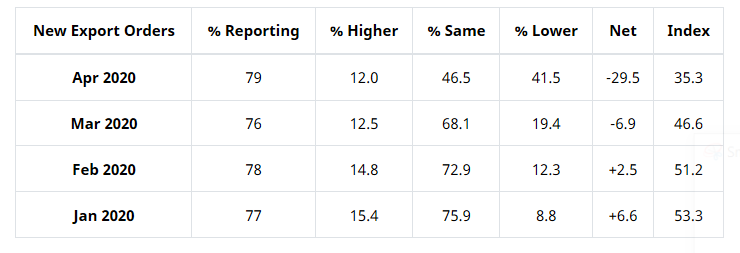
ISM®’s New Export Orders Index registered 35.3% during April, a decrease of 11.3 percentage points compared to the March reading of 46.6%, which is the index’s lowest reading since December 2008 (34.7%) and the largest one-month decline since a 12.9-percentage point decrease in October 2008. “The New Export Orders Index contracted heavily, with none of the six big industry sectors expanding. This indicates a clear slowdown in global demand,” said Fiore.
The only industry reporting growth in new export orders during April is Apparel, Leather & Allied Products. The 14 industries reporting a decrease in new export orders include Printing & Related Support Activities; Transportation Equipment; Miscellaneous Manufacturing; Textile Mills; Plastics & Rubber Products; Furniture & Related Products; Fabricated Metal Products; Nonmetallic Mineral Products; Machinery; Food, Beverage & Tobacco Products; Primary Metals; Computer & Electronic Products; Electrical Equipment, Appliances & Components; and Chemical Products.
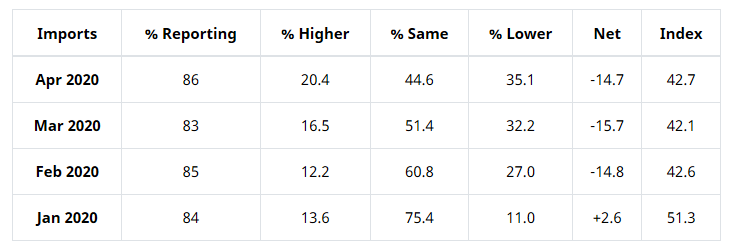
Imports*
ISM®’s Imports Index registered 42.7% during April, an increase of 0.6 percentage point compared to the 42.1% reported for March. “For the third consecutive month, imports were in contraction territory, with the index at levels not seen since May 2009, when it registered 38.5%. As was the case with supplier deliveries-related comments, respondents indicated the continuing impact from COVID-19 in global supply markets as the primary cause of reduced import activity,” explained Fiore.
U.S. import prices declined 2.6% in April, following a 2.4% decrease in March. Both monthly declines were led by falling fuel prices. Prices for U.S. exports fell 3.3% in April, after decreasing 1.7% the previous month. U.S. import prices fell 2.6% in April, the largest monthly drop since the index declined 3.2% in January 2015. The April decrease followed a 2.4% drop in March and a 0.7% decline in February. Prices for U.S. imports also fell on a 12-month basis, decreasing 6.8% for the year ended in April. The decrease was the largest 12-month drop since the index declined 8.3% from December 2014 to December 2015. – U.S. Bureau of Labor Statistics
The five industries reporting import growth during April include Apparel, Leather & Allied Products; Petroleum & Coal Products; Textile Mills; Nonmetallic Mineral Products; and Food, Beverage & Tobacco Products. The 11 industries reporting an import decrease are Plastics & Rubber Products; Transportation Equipment; Printing & Related Support Activities; Miscellaneous Manufacturing; Computer & Electronic Products; Electrical Equipment, Appliances & Components; Paper Products; Furniture & Related Products; Fabricated Metal Products; Primary Metals; and Machinery.
Import fuel prices declined 31.5% in April, after decreasing 26% in March. The April decline was the largest one-month drop since the index was first published monthly in September 1992. The decline in fuel prices was led by a 33% drop in the price index for import petroleum; natural gas prices also fell in April, decreasing 3.3%. Prices for import fuel declined 56.6% from April 2019 to April 2020, the largest 12-month drop since the index was first published in December 1984. Petroleum prices declined 58.5% over the past year, and more than offset a 5.9% advance in natural gas prices. – U.S. Bureau of Labor Statistics