KPI — May: State of the Economy
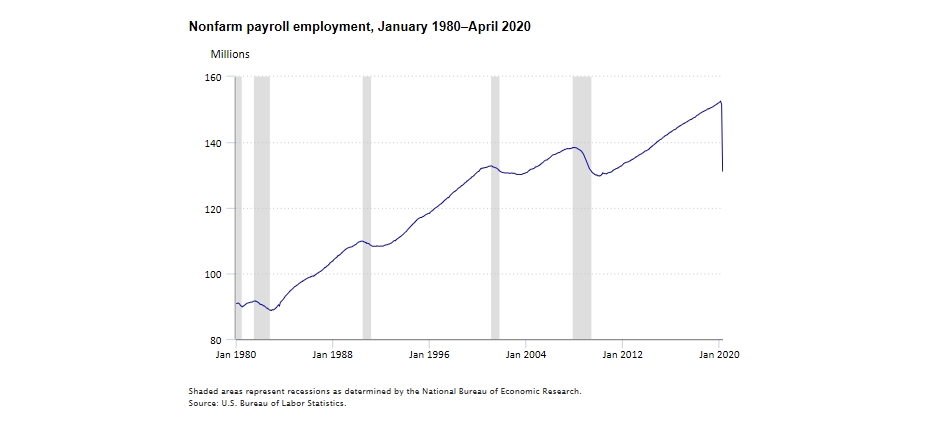
The U.S. economy shrank more than expected during the first quarter of the year, falling at a seasonally adjusted annual rate of 5% in the three-month period January – March, announced the Commerce Department.
Right alongside a decrease in GDP was a surge in the unemployment rate, up 10.3 percentage points to 14.7% during April 2020. It is the highest rate and largest month-over-month increase in the history of the data, which dates back to 1948. The downward trend continued into May, with more than 2.1 million people filing initial unemployment claims last week—tipping the jobless rate to 40.8 million.
All major worker groups were impacted: adult men – 13%, adult women – 15.5%, teenagers – 31.9%, Whites – 14.2%, Blacks – 16.7%, Asians – 14.5% and Hispanics – 18.9%.
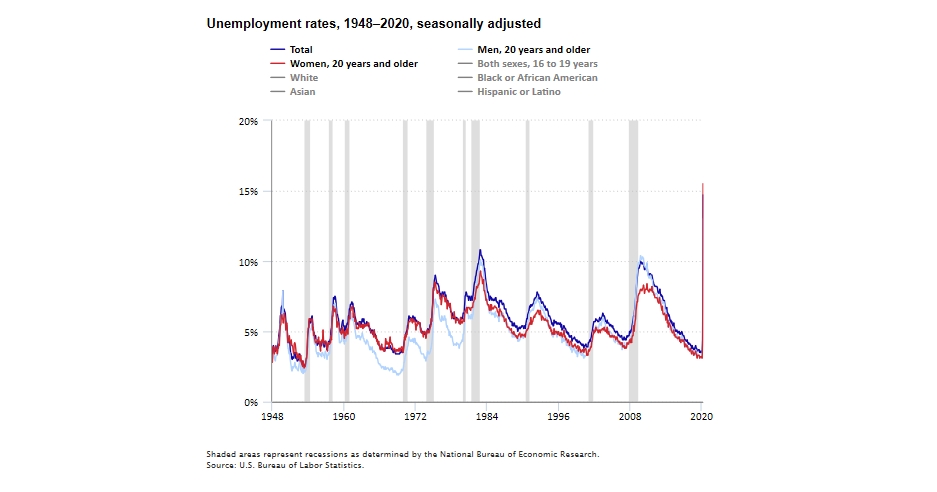
“Unemployment has widely been discussed over the last few months. In April, unemployment reached a record high of 14.7%, but about 18 million of the 23 million newly unemployed expect to be only temporarily out of work,” said Kyle Cheng of SEMA. “Consumers will ultimately decide when and how the economy reopens, but things are starting to look up. Getting those individuals back to work will be paramount in the coming months,” he added.
By Industry
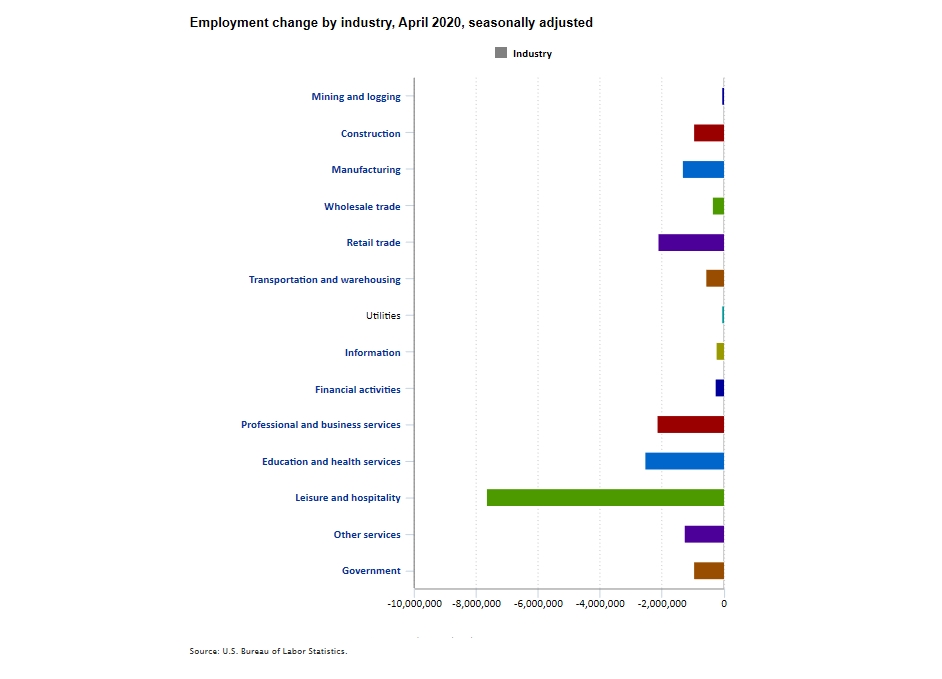
According to the Bureau of Labor Statistics, employment in leisure and hospitality plunged by 7.7 million, or 47%, during April 2020. Almost three-quarters of the decrease occurred in food services and drinking places (−5.5 million). Employment also fell in the arts, entertainment and recreation industry (−1.3 million), as well as the accommodation industry (−839,000).
Other important takeaways from April reporting include the following, courtesy of the U.S. Bureau of Labor Statistics:
• Employment declined by 2.5 million in education and health services. In health care, employment declined by 1.4 million, led by losses in offices of dentists, offices of physicians and offices of other health care practitioners. Employment also declined in social assistance (−651,000), reflecting job losses in child day care services and individual and family services.
• Professional and business services shed 2.2 million jobs. Sharp losses occurred in temporary help services (−842,000) and in services to buildings and dwellings (−259,000).
• Employment in retail trade declined by 2.1 million. Job losses occurred in clothing and clothing accessories stores (−740,000), motor vehicle and parts dealers (−345,000), as well as miscellaneous store retailers (−264,000). However, the component of general merchandise stores that includes warehouse clubs and supercenters gained 93,000 jobs. Wholesale trade shed 363,000 jobs, largely reflecting losses in the durable and nondurable goods components.
• Manufacturing employment dropped by 1.3 million. About two-thirds of the decline was in durable goods manufacturing (−914,000), which saw losses in motor vehicles and parts and in fabricated metal products.
• Employment in the other services industry declined by 1.3 million, with nearly two-thirds of the decline occurring in personal and laundry services (−797,000).
• Government employment dropped by 980,000. Employment in local government was down by 801,000, in part reflecting school closures. Employment also declined in state government education.
• Construction employment fell by 975,000, with much of the loss in specialty trade contractors (−691,000). Job losses also occurred in construction of buildings.
• Employment fell 584,000 in transportation and warehousing. Transit and ground passenger transportation and air transportation both lost jobs.
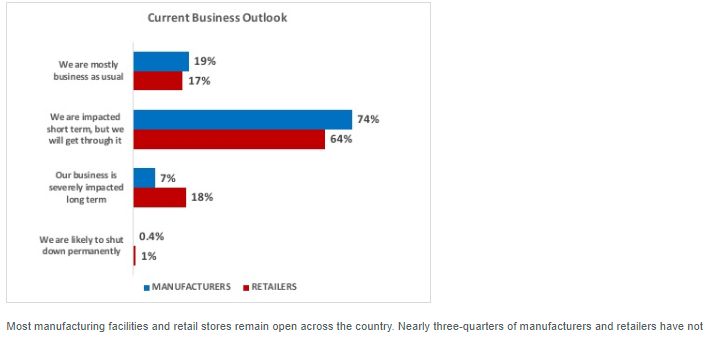
In a recent survey conducted by SEMA, nearly 90% of 2,000+ participants responded they are impacted short-term, but will get through it or are business as usual. “Bottom line, the specialty-equipment industry is open for business,” emphasized Kyle Cheng of SEMA.
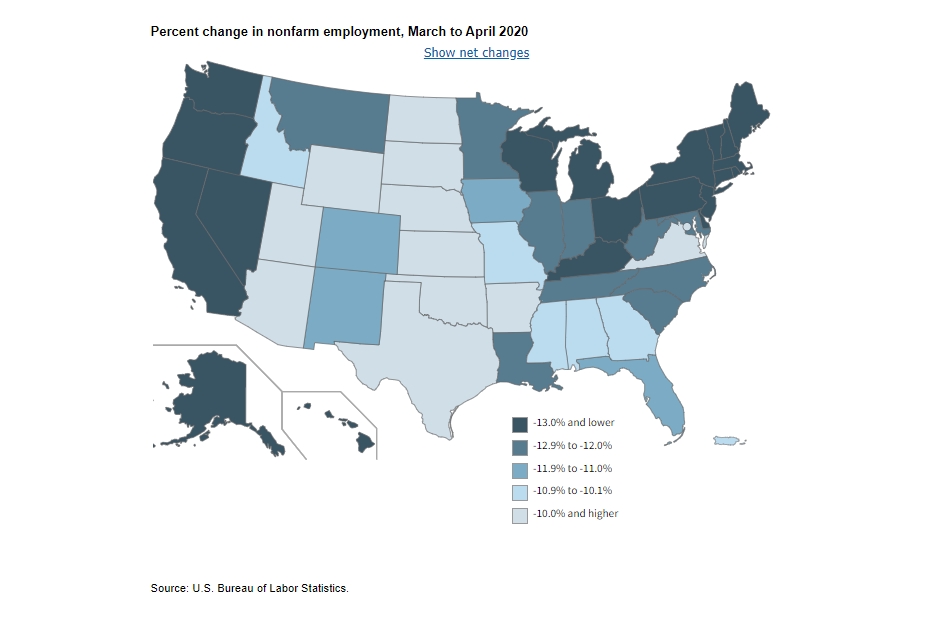
By Geography
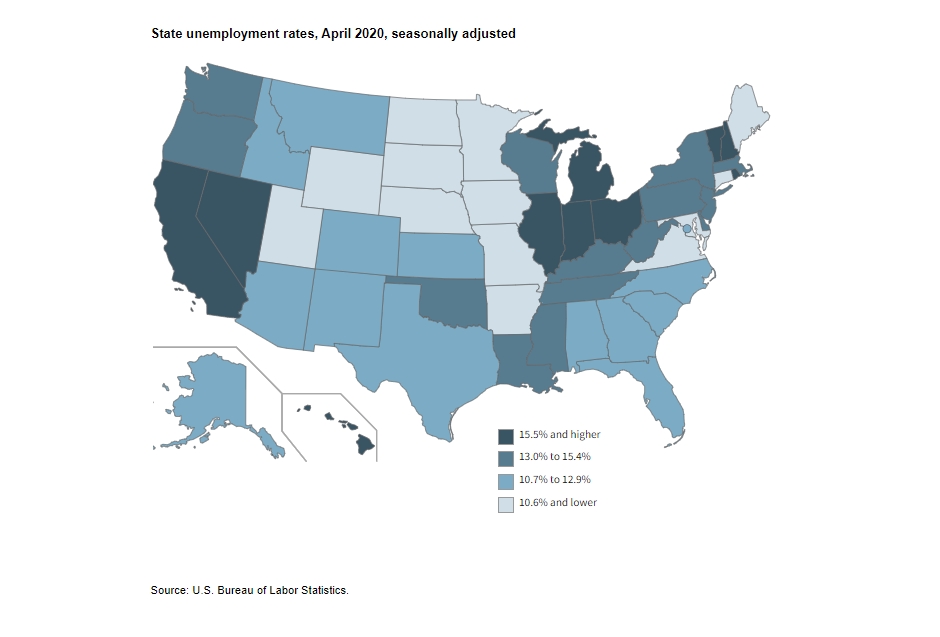
Currently, 43 states are at their highest unemployment levels since state unemployment data began in January 1976. For example, unemployment rates in Hawaii and Nevada exceeded their previous highs by more than 10 percentage points each, while the rates in Michigan, New Hampshire, Rhode Island and Vermont exceeded previous highs by more than five points each.
During April, Nevada reported the highest unemployment rate at 28.2%, followed by Michigan at 22.7% and Hawaii 22.3%. Connecticut had the lowest unemployment rate at 7.9%, followed by Minnesota at 8.1% and Nebraska at 8.3%. Furthermore, the District of Columbia and 27 states experienced unemployment rates lower than the U.S. rate of 14.7%, 10 states had higher rates and 13 states had rates that were not appreciably different from that of the nation.
Nonfarm payroll employment decreased in all 50 states and the District of Columbia during April 2020, according to the U.S. Bureau of Labor Statistics. The largest percentage declines occurred in Michigan (−22.8%), Vermont (−19.6%) and New York (−18.8%). The largest job declines occurred in California (−2,344,700), New York (−1,827,300) and Texas (−1,298,900).