
- KPI – May 2025: The Brief
- KPI – May 2025: State of Manufacturing
- KPI – May 2025: State of Business – Automotive Industry
- KPI – May 2025: Consumer Trends
- KPI – May 2025: Recent Vehicle Recalls
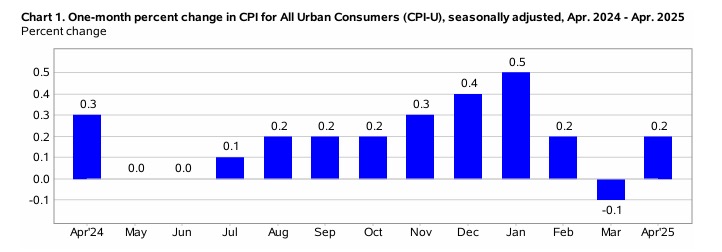
In April, the Consumer Price Index for All Urban Consumers (CPI-U) increased 0.2% on a seasonally-adjusted basis after falling 0.1% in March, according to the U.S. Bureau of Labor Statistics. Over the last 12 months, the all-items index increased 2.3% before seasonal adjustment.
Important takeaways, courtesy of the U.S. Bureau of Labor Statistics:
- The index for shelter rose 0.3% in April, accounting for more than half of the all-items monthly increase. In addition, the energy index increased 0.7%, while the index for food fell 0.1%. The food at home index decreased 0.4% and the food away-from-home index rose 0.4% over the month.
- Indexes on the rise include household furnishings and operations, medical care, motor vehicle insurance, education and personal care. Indexes for airline fares, used cars and trucks, communication and apparel decreased.
- The all-items index rose 2.3% year-over-year. The April change was the smallest 12-month increase in the all-items index since February 2021. The all items less food and energy index rose 2.8% over the last 12 months, while the energy index decreased 3.7%. The food index increased 2.8% over the last year.
 Employment
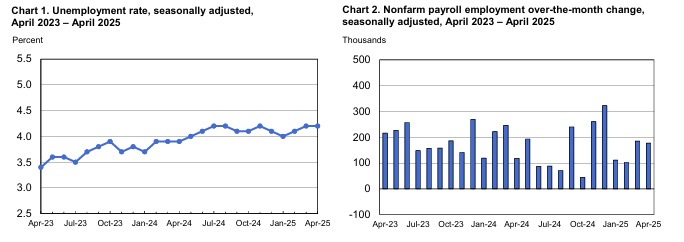
Total nonfarm payroll employment increased by 177,000 in April—slightly below the downwardly revised 185,000 in March but above the Dow Jones monthly estimate of 133,000. Employment continued to trend up in health care, transportation and warehousing, financial activities and social assistance. Federal government employment declined.
The unemployment rate and number of unemployed persons were relatively unchanged at 4.2% and 7.2 million, respectively. According to the U.S. Bureau of Labor Statistics, the labor force participation and long-term unemployed (those jobless for 27 weeks or more) rates were relatively unchanged at 62.6% and 23.5%, respectively.
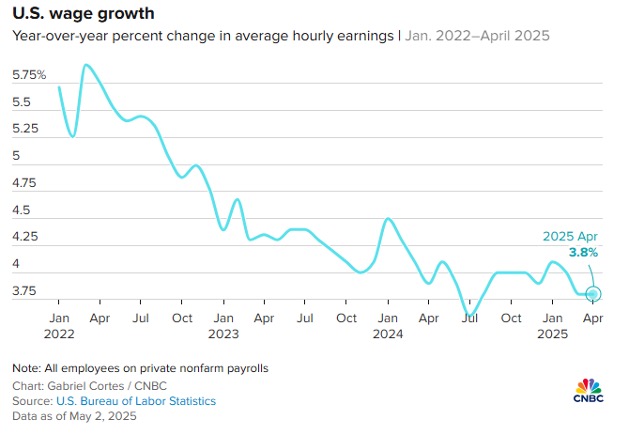
On the contrary, average hourly earnings rose merely 0.2% month-over-month, below the 0.3% forecast. Data shows the annual rate of 3.8% was 0.1 percentage point less than expected and the lowest since July 2024.
“We can push recession concerns to another month. Job numbers remain very strong, suggesting there was an impressive degree of resilience in the economy in play before the tariff shock,” says Seema Shah, chief global strategist at Principal Asset Management. “The economy will weaken in the coming months but, with this underlying momentum, the U.S. has a decent chance of averting recession if it can step back from the tariff brink in time.”
By Demographic
This month, unemployment rates among the major worker groups: adult women—3.7%; adult men—4%; teenagers—12.9%; Asians—3%; Whites—3.8%; Hispanics—5.2%; and Blacks—6.3%.
Last month, unemployment rates among the major worker groups: adult women—3.7%; adult men—3.8%; teenagers—13.7%; Asians—3.5%; Whites—3.7%; Hispanics—5.1%; and Blacks—6.2%.
![]()
By Industry
The Conference Board Employment Trends Index (ETI) decreased in April to 107.57, compared to a downwardly revised 108.41 in March.
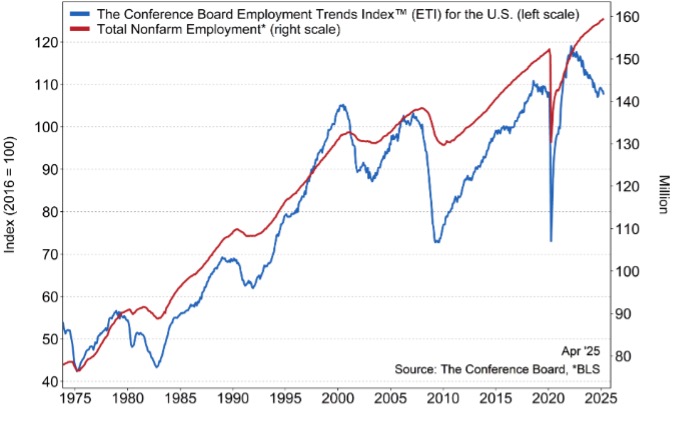
Caption: The Employment Trends Index is a leading composite index for payroll employment. When the Index increases, employment is likely to grow as well, and vice versa. Turning points in the Index indicate that a change in the trend of job gains or losses is about to occur in the coming months.
Important takeaways, courtesy of The Conference Board ETI:
- The share of consumers who report “jobs are hard to get”—an ETI component from the Consumer Confidence Survey—rose for the third consecutive month to 16.6%, the highest share since October.
- The share of small firms that report jobs are “not able to be filled right now” (an ETI component) fell by 6% to 34%, the lowest mark since September.
- Real Manufacturing and Trade Sales continued to demonstrate post-election strength in the most recently released February data, showing annual growth of 3.2%.
- The share of involuntary part-time workers declined for the second consecutive month (17.1%). Employment in the temporary-help industry grew by 3,600, its first monthly gain in 2025, partially offsetting 12,900 net losses over January to March.
- Initial claims for unemployment insurance rose slightly, but the current level of 226,000 is equal to the series’ 12-month average, indicating no increasing trend.
- However, job openings continued to fall through March and may indicate that uncertainty is creating greater hesitation in hiring for businesses. Revisions to job openings in recent months now show a total decline of nearly 840,000 since November.
“While confidence in the labor market has slipped, it’s still unclear how much of a pullback in hiring or a rise in layoffs we’ll see from these anticipated tariff impacts. But it is almost certain that the labor market’s streak of resiliency will be tested in the months ahead,” says Mitchell Barnes, economist at The Conference Board.
Important takeaways, courtesy of the U.S. Bureau of Labor Statistics:
- Health care added 51,000 jobs in April. Job growth continued in hospitals (+22,000) and ambulatory health care services (+21,000).
- Employment in transportation and warehousing increased by 29,000. Job gains occurred in warehousing and storage (+10,000), couriers and messengers (+8,000) and air transportation (+3,000).
- Financial activities employment continued to trend up (+14,000).
- Employment in social assistance rose (+8,000) but at a slower pace than the average monthly gain over the prior 12 months (+20,000).
- Within government, federal government employment declined by 9,000 and is down by 26,000 since January. (Employees on paid leave or receiving ongoing severance pay are counted as employed in the establishment survey.)
Click here to review more employment details.


