
KPI – May 2024: State of Manufacturing
KPI – May 2024: State of Business – Automotive Industry
KPI – May 2024: State of the Economy
KPI – May 2024: Recent Vehicle Recalls
Below is a synopsis of consumer confidence, sentiment, demand and income/spending trends.
The Conference Board Consumer Confidence Index® deteriorated for the third consecutive month, plummeting from a downwardly revised 103.1 in March to a dismal 97.0 (1985=100) in April – its lowest level since July 2022. The Present Situation Index – based on consumers’ assessment of current business and labor market conditions – declined to 142.9 (1985=100) in April from a downwardly revised 146.8 in March. In addition, the Expectations Index – based on consumers’ short-term outlook for income, business and labor market conditions – nosedived to 66.4 (1985=100) from a slightly upwardly revised 74.0 last month. Historically, an Expectations Index reading below 80 signals a forthcoming recession.
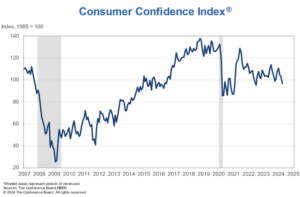
According to Dana Peterson, chief economist at The Conference Board, data shows confidence declined among consumers of all age and nearly all income groups, except for the $25,000 to $49,999 bracket. In particular, she says consumers under age 35 continued to express greater confidence compared to those over 35. In April, households with incomes below $25,000 and above $75,000 reported the largest deteriorations in confidence. By contrast, confidence among consumers earning less than $50,000 remained stable over the past six months.
Elevated price levels, especially in categories like food and gas, dominated consumer concerns. Politics and global conflicts were top of mind as well. In addition, consumers were less optimistic about their family’s financial situation, both currently and over the next six months.
According to a supplemental survey question, consumers noted they would cut back on discretionary purchases to save money, including food away from home, clothing/fashion items, entertainment away from home and vacations. Meanwhile, data shows fewer consumers plan to reduce spending on non-discretionary purchases like childcare, education and health care.
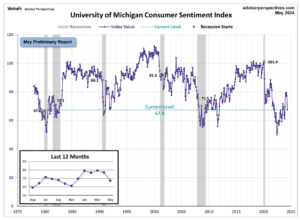
Similarly, the University of Michigan Survey of Consumers – a survey consisting of approximately 50 core questions covering consumers’ assessments of their personal financial situation, buying attitudes and overall economic conditions – finished at 77.2 in April, down from 79.4 in March. Of concern, May’s preliminary reading stands at 67.4, the lowest reading in approximately six months.
“This month’s trend in sentiment is characterized by a broad consensus across consumers, with decreases across age, income and education groups,” says Joanne Hsu, director of Survey of Consumers. “Consumers in western states exhibited a particularly steep drop. While consumers had been reserving judgment for the past few months, they now perceive negative developments on a number of dimensions. They expressed worries that inflation, unemployment and interest rates may all be moving in an unfavorable direction in the year ahead.”
- Year-ahead inflation expectations increased from 3.2% last month to 3.5% this month, above the 2.3-3.0% range seen in the two years prior to the pandemic.
- Long-run inflation expectations inched up from 3% last month to 3.1% this month. Although they have been within the narrow 2.9-3.1% range for 30 of the last 34 months, long-run inflation expectations remain elevated relative to the 2.2-2.6% range recorded in the two years pre-pandemic.
Consumer Income & Spending
According to the U.S. Bureau of Economic Analysis (BEA), in March 2024 personal income increased $122 billion (0.5% at a monthly rate), while disposable personal income – personal income less personal current taxes – climbed $104 billion (0.5%) and personal consumption expenditures (PCE) jumped $160.9 billion (0.8%).
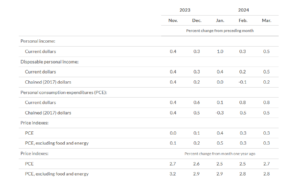
In addition, personal outlays – the sum of personal consumption expenditures, personal interest payments and personal current transfer payments – increased $172.1 billion. Personal saving was $671 billion in March and the personal saving rate – personal saving as a percentage of disposable personal income – registered 3.2%.
Important Takeaways, Courtesy of BEA:
- In March, the $160.9 billion increase in current-dollar PCE reflected an increase of $80.6 billion in spending for services and a $80.3 billion increase in spending for goods. Within services, the largest contributors to the increase were health care (both outpatient and hospital services), as well as housing and utilities (led by housing). Within goods, the largest contributors included gasoline and other energy goods (led by motor vehicle fuels, lubricants and fluids), other nondurable goods (led by recreational items) and food and beverages.
- Overall, the PCE price index rose 0.3% month-over-month in March. Prices for services increased 0.4%, while prices for goods ticked up 0.1%. Food prices decreased a nominal 0.1%, while energy prices increased 1.2%. The same index increased 2.7% year-over-year, with food and energy prices increasing 1.5% and 2.6%, respectively.


