KPI — May 2023: Consumer Trends

The Conference Board Consumer Confidence Index® declined to 101.3 (1985=100) in April, down from 104.0 in March. The Present Situation Index – based on consumers’ assessment of current business and labor market conditions – increased to 151.1 (1985=100) from 148.9 last month. Meanwhile, the Expectations Index – based on consumers’ short-term outlook for income, business and labor market conditions – dropped to 68.1 (1985=100) from 74.0. The Expectations Index registered below 80 during the last 13 of 14 months – a level which often signals a recession ahead.
According to recent data, consumer confidence declined most among those under 55 years of age and for households earning $50,000 and over. Consumers expressed a pessimistic outlook for both business conditions and labor markets, notes Ataman Ozyildirim, senior director of economics at The Conference Board. Compared to last month, he says fewer households predict business conditions will improve and more expect worsening conditions in the next six months.
Moreover, while 12-month inflation expectations remain relatively unchanged month-over-month, Ozyildirim says consumers are showing early signs of “pulling back spending” in the face of persistently high prices and rising interest rates. Recent data shows consumers are applying the brakes in purchasing appliances, vehicles, homes and even vacations. According to Ozyildirim, it may be a signal that consumers are “economizing amid growing pessimism.”

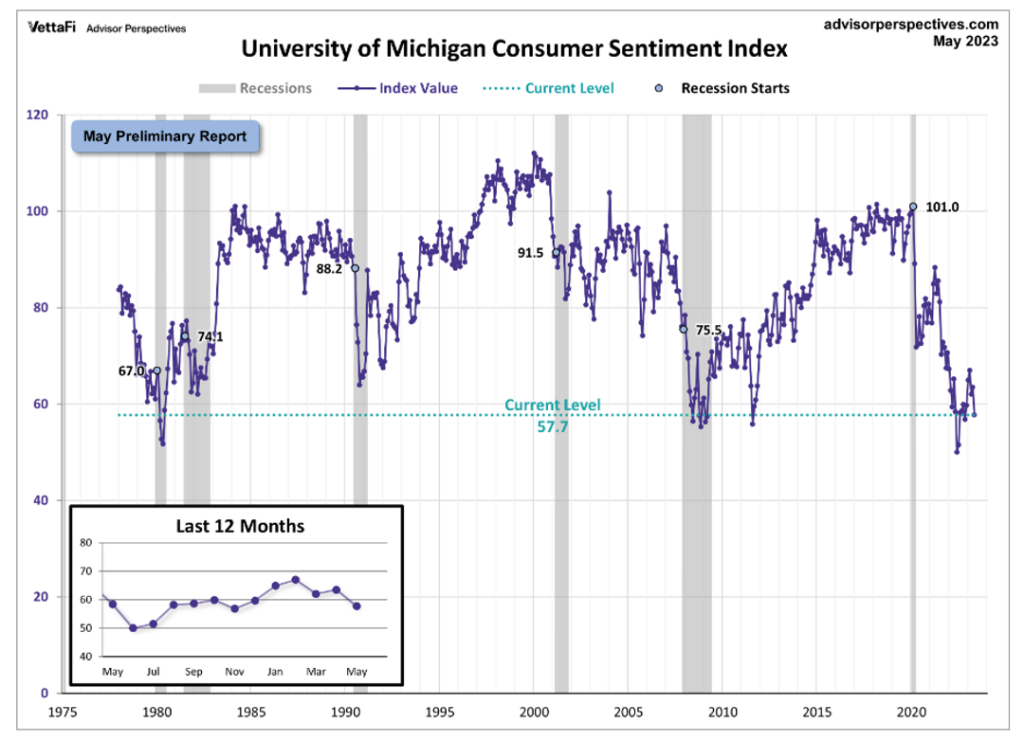
The chart evaluates the historical context for this index as a coincident indicator of the economy. Toward this end, Advisor Perspectives highlighted recessions and included GDP. To put the current data into better perspective, professionals state consumer sentiment is 32.3% below its average reading (arithmetic mean) and 31.4% below its geometric mean. The current index level is at the 2nd percentile of the 545 monthly data points in this series. The indicator is somewhat volatile, with a 3.1-point absolute average monthly change.
The University of Michigan Survey of Consumers – a survey consisting of approximately 50 core questions covering consumers’ assessments of their personal financial situation, buying attitudes and overall economic conditions – registered 63.5 in April, with May preliminary reporting at 57.7 (down 5.8, or 9.1%, from the April final).
“Consumer sentiment tumbled 9% amid renewed concerns about the trajectory of the economy, erasing over half of the gains achieved after the all-time historic low from last June,” says Joanne Hsu, director of Survey of Consumers. “While current incoming macroeconomic data show no sign of recession, consumers’ worries about the economy escalated in May alongside the proliferation of negative news about the economy, including the debt crisis standoff.”
Important Takeaways, Courtesy of Survey of Consumers:
- Year-ahead expectations for the economy plummeted 23% from last month. In addition, long-run expectations slid by 16%, which indicates consumers are concerned an economic downturn will not be brief.
- Year-ahead inflation expectations receded slightly to 4.5% in May.
- Long-run inflation expectations rose to their highest level since 2011, lifting from 3% last month to 3.2% this month.
“Throughout the current inflationary episode, consumers have shown resilience under strong labor markets, but their anticipation of a recession will lead them to pull back when signs of weakness emerge. If policymakers fail to resolve the debt ceiling crisis, these dismal views over the economy will exacerbate the dire economic consequences of default,” Hsu adds.
Consumer Income & Spending
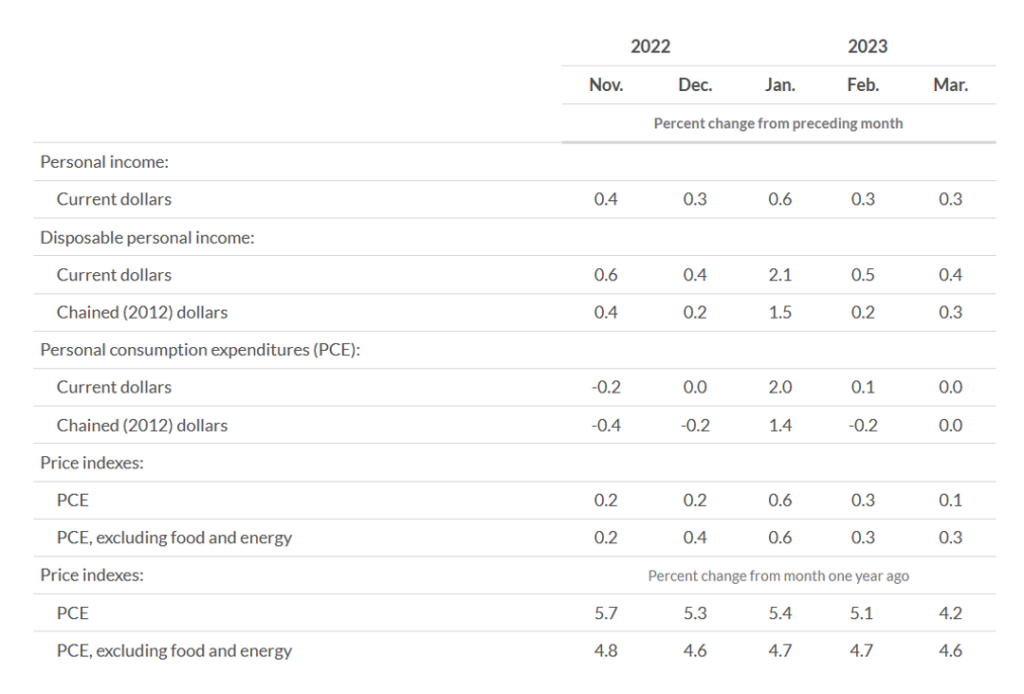
According to the U.S. Bureau of Economic Analysis (BEA), in March 2023 personal income increased $67.9 billion (0.3%), disposable personal income (DPI) increased $71.7 billion (0.4%) and personal consumption expenditures (PCE) increased $8.2 billion (less than 0.1%).
In addition, personal outlays increased $21.5 billion. Personal saving was $1 trillion and the personal saving rate – personal saving as a percentage of disposable personal income – was 5.1%.

Important Takeaways, Courtesy of BEA:
- The $8.2 billion increase in current-dollar PCE reflected a $44.9 billion increase in spending for services, which was partly offset by a $36.7 billion decrease in spending for goods. A decrease in goods was led by motor vehicles and parts, as well as gasoline and other energy goods. Within services, the largest contributors to the increase were spending for housing and utilities, plus health care services.
- The PCE price index increased 0.1% month-over-month. Prices for goods decreased 0.2% and prices for services increased 0.2%. Food and energy prices decreased 0.2% and 3.7%, respectively. Excluding food and energy, the PCE price index increased 0.3%.
- The PCE price index increased 4.2% year-over-year. Prices for goods and services increased 1.6% and 5.5%, respectively. Food prices increased 8%, while energy prices decreased 9.8%. Excluding food and energy, the PCE price index increased 4.6% year-over-year.
Key Performance Indicators Report — May 2023


