KPI — March 2023: State of Business
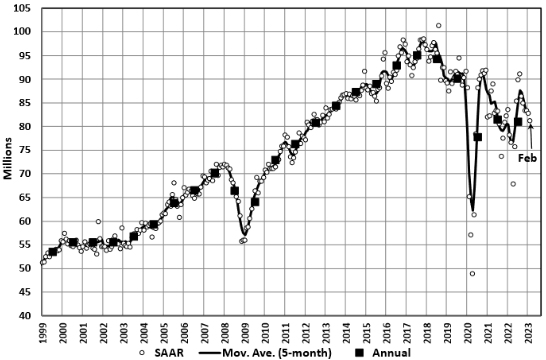
LMC Automotive reports Global Light Vehicle (LV) sales volume fell to 81 million units per year in February. The month-over-month decline in SAAR performance is largely attributed to a deceleration in the Chinese market due, in part, to the Chinese New Year and the termination of tax incentives. North America and Western Europe both posted year-over-year increases, with Eastern Europe still struggling to overcome negative growth. While global supply-side constraints continue to impact recovery, raw monthly registrations increased to 6.5 million units – approximately 11% year-over-year growth.
“The forecast for 2023 is holding at a 6% increase, with global light-vehicle sales rounding up to 85.9 million units. While the outlook still bears a high level of uncertainty, disruption is easing some and other risks also appear to be more balanced. Markets are resilient and economies around the world are holding up fairly well, which should keep the automotive recovery on track,” says Jeff Schuster, president of global forecasts at LMC Automotive.
State of Manufacturing
Economic activity in the manufacturing sector contracted in February for the fourth consecutive month following a 28-month period of growth, according to the nation’s supply executives in the most recent Manufacturing ISM® Report On Business®. The Manufacturing PMI® registered 47.7%, 0.3 percentage point higher than the 47.4% recorded in January.
“The U.S. manufacturing sector again contracted, with the Manufacturing PMI® improving marginally over the previous month. With Business Survey Committee panelists reporting softening new order rates over the previous nine months, the February composite index reading reflects companies continuing to slow outputs to better match demand for the first half of 2023 and prepare for growth in the second half of the year,” says Timothy R. Fiore, CPSM, C.P.M., chair of the Institute for Supply Management® (ISM®) Manufacturing Business Survey Committee.
Important takeaways, Courtesy of the Manufacturing ISM® Report On Business®:
- Demand eased, with the (1) New Orders Index contracting at a slower rate, (2) New Export Orders Index still below 50% but continuing to improve, (3) Customers’ Inventories Index remaining at ‘too low’ levels, a positive for future production and (4) Backlog of Orders Index recovering for a third month but still in moderate contraction.
- Output/Consumption (measured by the Production and Employment indexes) was negative, with a combined 2.2-percentage point downward impact on the Manufacturing PMI® calculation.
- The Employment Index returned to contraction after two months of expansion, and the Production Index logged a third month in contraction territory. Panelists’ companies continue to indicate that they will not substantially reduce head counts, as sentiment is positive about the second half of the year – though slightly less so compared to January.
- Inputs – defined as supplier deliveries, inventories, prices and imports – continue to accommodate future demand growth.
- The Supplier Deliveries Index indicated faster deliveries, and the Inventories Index expanded at a slower rate as panelists’ companies manage their total supply chain inventories.
- The Prices Index jumped back into ‘increasing’ territory after four consecutive months below 50%, supporting agreement between buyers and sellers to place orders in the near term.
U.S. New Vehicle Sales
Total new vehicle sales, including retail and non-retail transactions, are projected to reach 1,117,100 units in February 2023 – a 7.2% year-over-year increase, according to a joint forecast from J.D. Power and LMC Automotive.
“Despite economic headwinds, the auto industry is on track to deliver year-over-year sales growth alongside record transaction prices and record consumer expenditures for the month of February. Improving vehicle availability is allowing more retail and fleet customers who have been waiting on the sidelines to finally buy a new vehicle,” says Thomas King, president of the data and analytics division at J.D. Power.
The February total sales growth is largely attributed to fleet customers, as manufacturers continue to increase production and make more vehicles available to this segment of the industry.
Important Takeaways, Courtesy of J.D. Power:
- Retail buyers are on pace to spend $42 billion on new vehicles, up $2 billion year-over-year.
- Truck/SUVs are on pace to account for 79.2% of new vehicle retail sales.
- The average new vehicle retail transaction price in February is expected to reach $46,229, a 4.8% year-over-year increase.
- Average interest rates for new-vehicle loans are expected to increase to 6.78%, 252 basis points higher than a year ago.
- Total retailer profit per unit – inclusive of grosses and finance and insurance income – is on pace to be $3,820, which is down 23.3% from a year ago but still more than double 2019.
- Fleet sales are expected to total 209,200 units in February, up 54.2% year-over-year on a selling day adjusted basis. Fleet volume is expected to account for 19% of total light-vehicle sales, up from 13% a year ago.
Even with the positive gains in February, King says the industry is “still not reaching its sales volume potential.” While supply is consistently increasing, inventory levels are not sufficient to fulfill demand each month. As a result, he says industry profitability will remain well above historical levels throughout 2023 but will deteriorate during the course of the year.
U.S. Used Market
According to JD Power, used-vehicle prices are declining. This is resulting in less trade-in equity for new-vehicle buyers. Currently, the average trade-in equity is around $8,955, which is down $333 from a year ago and down $1,095 since the peak in June 2022. For context, JD Power says trade equity is still more than double the pre-pandemic level, thus helping owners with a vehicle to trade in offset some of the pricing and interest rate hikes.
Wholesale used-vehicle prices (on a mix, mileage and seasonally adjusted basis) increased 4.3% month-over-month in February. Manheim credits this as the largest increase for the full month of February since 2009’s 4.4% rise.
Manheim Market Report (MMR) values in February were elevated, culminating in a 2.4% increase in the Three-Year-Old Index over the last four weeks. In February, daily MMR Retention, which is the average difference in price relative to the current MMR, averaged 100.1%. This means market prices were very close to MMR values. The average daily sales conversion rate increased to 64.3% and was above normal for the time of year. For example, the daily sales conversion rate averaged 55.3% in January 2019. Manheim says the higher conversion rate indicates that sellers had more pricing power than what is typically seen for this time of year.
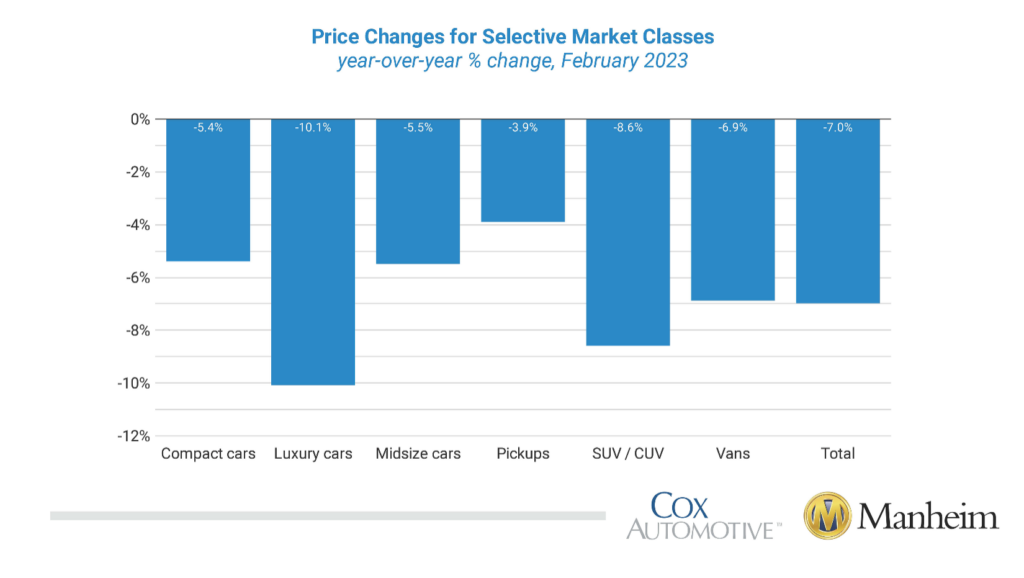
According to Manheim, all eight major market segments posted seasonally-adjusted prices that were lower year-over-year in February. Pickups recorded the smallest decline at 3.9%, with compact cars, midsize cars and vans decreasing less than the overall industry year-over-year. Luxury cars, SUVs and sports cars declined 10.1%, 8.6% and 7.4%, respectively, compared to last year. All eight major segments saw significant price increases compared to January, with gains between 3.3% and 5.9%.
KPI — March 2023: Recent Vehicle Recalls
Key Performance Indicators Report — March 2023


