KPI — March 2023: Consumer Trends
The Conference Board Consumer Confidence Index® decreased in February for the second consecutive month. The Index now stands at 102.9 (1985=100), down from 106.0 in January (a downward revision). The Present Situation Index – based on consumers’ assessment of current business and labor market conditions – increased to 152.8 (1985=100) from 151.1 last month. The Expectations Index – based on consumers’ short-term outlook for income, business and labor market conditions – fell to 69.7 (1985=100) from a downwardly revised 76.0 in January. Most notably, recent data shows the Expectations Index is well below 80 over the past year – a level which traditionally signals a recession on the horizon.
According to recent data, consumer confidence declined most among ages 35 to 54 and for households earning $35,000 or more. Last month, consumers were less upbeat about the short-term outlook for jobs and predicted business conditions to worsen in the near term. However, they expected income levels to remain relatively stable in the months ahead.
Now, the long-term outlook appears “considerably more pessimistic,” as consumer expectations about jobs, incomes and business conditions over the next six months all fell sharply in February, notes Ataman Ozyildirim, senior director of economics at The Conference Board.
Moreover, while 12-month inflation expectations improved – falling to 6.3% from 6.7% last month – Ozyildirim says consumers may be showing early signs of “pulling back spending” in the face of high prices and rising interest rates. Recent data shows consumers are applying the brakes in purchasing appliances, vehicles, homes and even vacations.
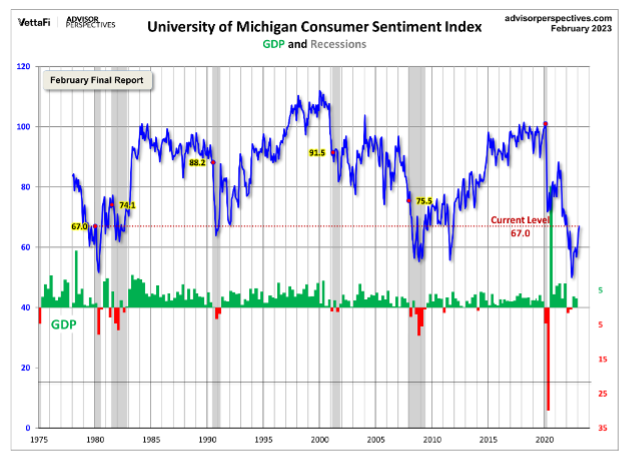
The chart evaluates the historical context for this index as a coincident indicator of the economy. Toward this end, Advisor Perspectives highlighted recessions and included GDP. To put the current data into better perspective, professionals state consumer sentiment is 21.5% below its average arithmetic mean and 20.5% below its geometric mean. The current index level is at the 11th percentile of the 542 monthly data points in the series. This indicator is somewhat volatile, with a 3.1-point absolute average monthly change. The latest data point saw a 2.1-point increase from the previous month.
The University of Michigan Survey of Consumers – a survey consisting of approximately 50 core questions covering consumers’ assessments of their personal financial situation, buying attitudes and overall economic conditions – registered 67.0 in February, up 2.1 (3.2%) from the January final.
Important Takeaways, Courtesy of Survey of Consumers:
- Currently, sentiment is 17 index points above the all-time low in June 2022 but remains nearly 20 points below its historical average.
- Overall, February’s reading was supported by a 12% improvement in the short-run economic outlook, while all other index components were essentially unchanged.
- Year-ahead inflation expectations rebounded to 4.1% compared to 3.9% in January and 4.4% in December. Consumers continued to exhibit considerable uncertainty over short-run inflation, thus their expectations may be unstable in the months to come.
- Long-run inflation expectations remained at 2.9% for the third straight month and stayed within the narrow 2.9-3.1% range for 18 of the last 19 months.
“Consumers are very much bracing for a downturn, bracing for more unemployment – and so they are going to be continuing to be cautious with their spending,” says Joanne Hsu, director at Survey of Consumers.
Consumer Income & Spending
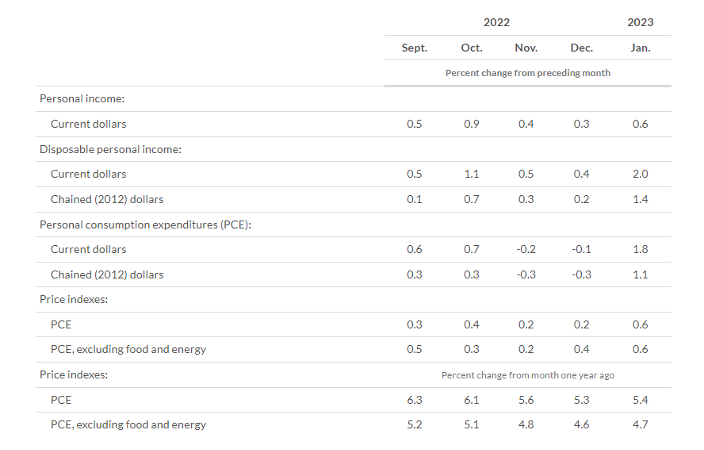
According to the U.S. Bureau of Economic Analysis (BEA), in January 2023 personal income increased $131.1 billion (0.6%), disposable personal income (DPI) increased $387.4 billion (2%) and personal consumption expenditures (PCE) increased $312.5 billion (1.8%).
In addition, personal outlays increased $326.8 billion. Personal saving was $918.8 billion and the personal saving rate – personal saving as a percentage of disposable personal income – registered 4.7%.
Important Takeaways, Courtesy of BEA:
- The $312.5 billion increase in current-dollar PCE in January reflected increases of $162.2 billion in spending for goods and $150.2 billion related to services. Within goods, the increase was widespread –
led by motor vehicles and parts, as well as “other” nondurable goods like pharmaceuticals. Food services was the largest contributor to the increase within services.
- The PCE price index increased 0.6% in January. Excluding food and energy, the PCE price index also increased 0.6%. Real DPI increased 1.4% and Real PCE increased 1.1%, while goods increased 2.2% and services increased 0.6%.
- The PCE price index for January increased 5.4% year-over-year. Prices for goods increased 4.7% and 5.7% for services. Food prices soared 11.1%, while energy prices rose 9.6%. Excluding food and energy, the PCE price index increased 4.7% year-over-year.
Key Performance Indicators Report — March 2023