KPI — March 2022: Consumer Trends
The Conference Board Consumer Confidence Index® decreased again in February. The Index now stands at 110.5 (1985=100), down from 111.1 in January and 115.8 in December. The Present Situation Index – based on consumers’ assessment of current business and labor market conditions – improved to 145.1 from 144.5 last month. The Expectations Index – based on consumers’ short-term outlook for income, business and labor market conditions – declined to 87.5 from 88.8.
“The Present Situation Index improved a touch, suggesting the economy continued to expand in Q1 but did not gain momentum. Expectations about short-term growth prospects weakened further, pointing to a likely moderation in growth over the first half of 2022,” says Lynn Franco, senior director of economic indicators at The Conference Board.
Meanwhile, the proportion of consumers planning to purchase homes, automobiles, major appliances and vacations over the next six months all fell.
“After decades of relatively low levels, inflation is on everyone’s mind and has been making consumers and businesses miserable as prices have picked up dramatically over the past year,” adds Jack Kleinhenz, chief economist at the National Retail Federation (NRF). “However you measure it, inflation has become a powerful force and plays a key role in the nation’s economic outlook.”
As a result, consumer confidence and spending will continue to face headwinds from rising prices in the coming months.
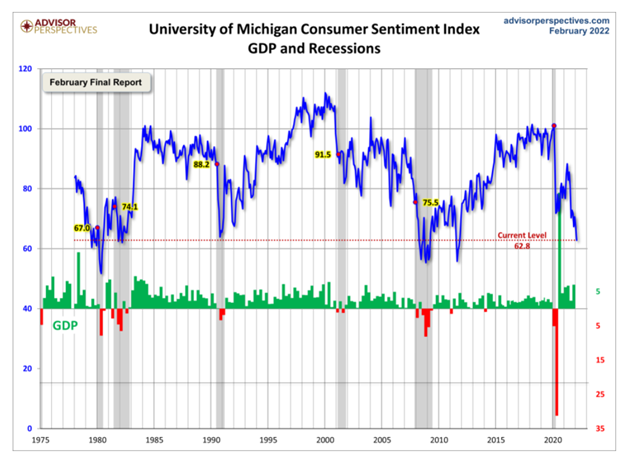
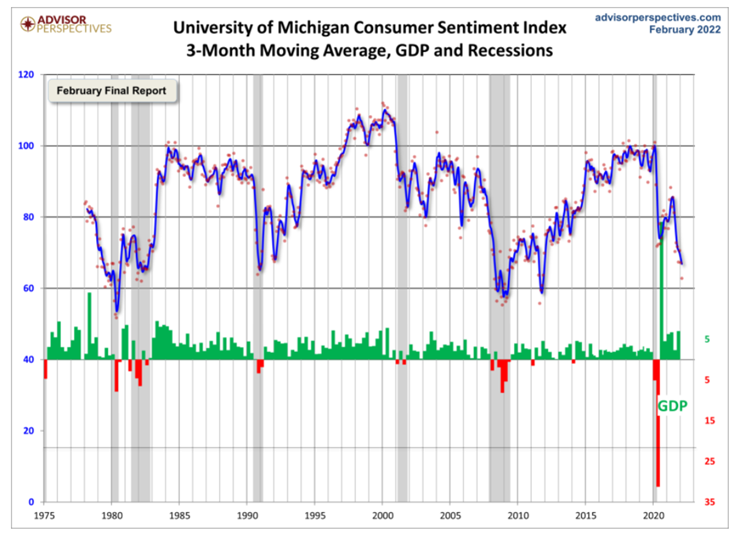
Since the inception of the report in 1978, consumer sentiment is 26.9% below the average reading (arithmetic mean) and 26.1% below the geometric mean. The current index level is at the 4th percentile of the 530 monthly data points in this series. Note that this indicator is somewhat volatile, with a 3-point absolute average monthly change. The latest data point saw a 4.4-point decrease from the previous month.
Similarly, The Consumer Sentiment Index – a survey consisting of approximately 50 core questions covering consumers’ assessments of their personal financial situation, buying attitudes and overall economic conditions –decreased to 62.8 in February from 67.2 in January – the lowest level in the past decade, according to the University of Michigan Survey of Consumers.
“The financial harm and growing angst among consumers about rising inflation have pushed nearly nine-in-ten consumers to anticipate interest rate hikes. The Fed’s clinging to the transient hypothesis meant missed opportunities to nip inflation at its earliest stages; aggressive actions are now needed to avoid the potential establishment of an inflationary psychology that acts to form a self-fulfilling prophecy,” says Richard Curtin, Surveys of Consumers chief economist.
Consumer Income & Spending
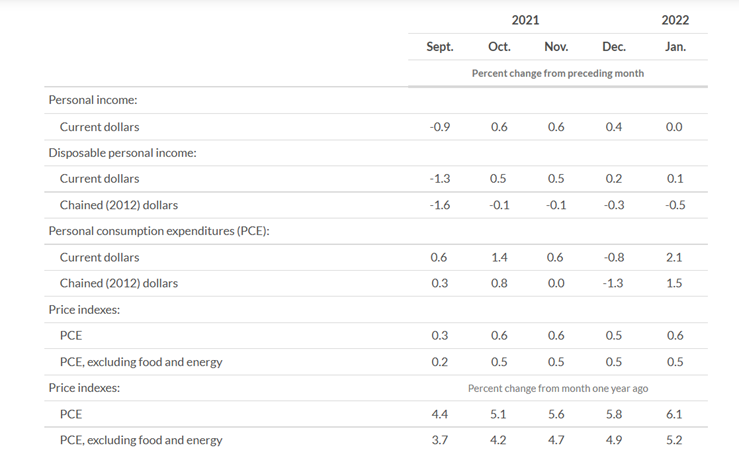
According to the U.S. Bureau of Economic Analysis (BEA), personal income increased $9 billion (less than .1%) in January. Disposable personal income (DPI) increased $19.8 billion (.1%) and personal consumption expenditures (PCE) increased $337.2 billion (2.1%).
The increase in personal income primarily reflects an increase in compensation which was partly offset by a decrease in government social benefits, notes BEA. Within compensation, for example, the increase show increases in both private and government wages and salaries.
Important Takeaways, Courtesy of BEA:
- The $337.2 billion increase in current-dollar PCE reflects an increase of $285.4 billion in spending for goods and a $51.8 billion increase in spending for services.
- Within goods, increases were widespread – led by motor vehicles and parts, “other” nondurable goods and recreational goods and vehicles.
- Within services, the largest contributor to the increase was spending for housing and utilities.
- Personal outlays increased $342.2 billion. Personal saving was $1.17 trillion, while the personal saving rate – personal saving as a percentage of disposable personal income – was 6.4%.
- The PCE price index increased 6.1% year-over-year, reflecting increases in both goods and services. Energy prices increased 25.9%, while food prices increased 6.7%. Excluding food and energy, the PCE price index for January increased 5.2% year-over-year.
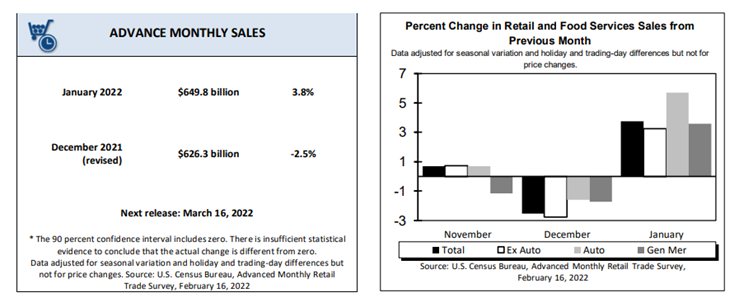
According to the U.S. Census Bureau, advance estimates of U.S. retail and food services sales for January 2022 – adjusted for seasonal variation, holiday and trading-day differences but not for price changes – were $649.8 billion, an increase of 3.8% (±.5%) from the previous month and 13% (±.9%) above January 2021. Total sales for the November 2021 through January 2022 period were up 16.1% (±.7%) year-over-year. The November 2021 to December 2021 percent change was revised from down 1.9% (±.5%) to down 2.5% (±.3%). Retail trade sales were up 4.4% (±.4%) from December 2021 and up 11.4% (±.7%) year-over-year. Gasoline stations were up 33.4% (±1.8%) from January 2021, while food services and drinking places were up 27% (±4.4%) year-over-year.
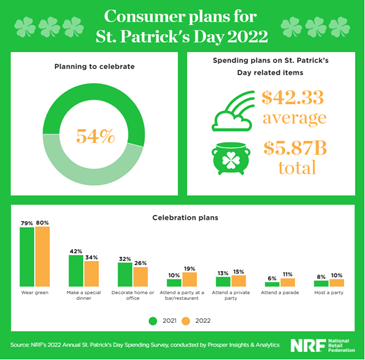
While inflation may be red hot, 54% of consumers are expected to spend an average of $42.33 on St. Patrick’s Day in 2022.
Key Performance Indicators Report — March 2022


