KPI — March 2021: State of the Economy

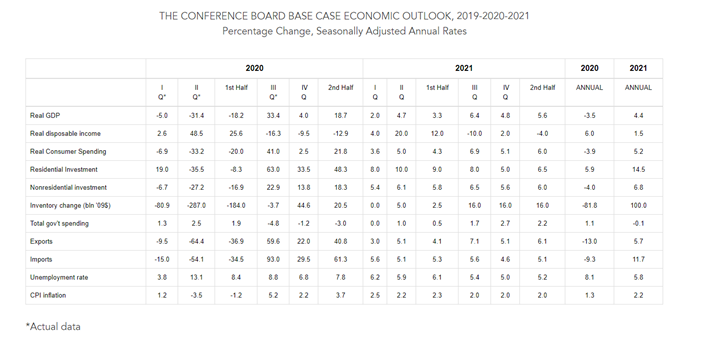
The Conference Board revised its real GDP projection, forecasting a 2% increase (annualized rate) in Q1 2021 and 4.4% year-over-year growth.*
“Following a lull in the economic recovery during recent months, we expect the pace of the rebound to reaccelerate as new COVID-19 infection rates decline, the vaccination program expands and the prospects of another large fiscal support program improve. We expect the recovery to continue into next year and forecast growth of 3.1% year-over-year growth in 2022,” according to the company.
The Conference Board has generated three potential recovery scenarios based on specific sets of assumptions.
All data and analysis are courtesy of The Conference Board.
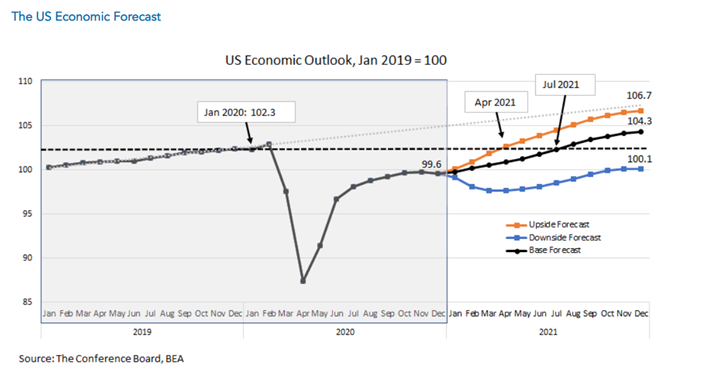
- Base Forecast: The base case forecast yields Q1 2021 real GDP growth of 2% (annualized rate), and an annual, year-over-year expansion of 4.4%* The recovery likely will continue into next year and yield an annual, year-over-year growth rate of 3.1% in 2022. This scenario is the most probable and assumes: a) new cases of COVID-19 peak in early Q1 2021 and no widespread lockdowns are implemented; b) COVID-19 vaccinations rise in Q1 2021, are broadly available in Q2 and universally available in Q3; c) $1.5 trillion in additional fiscal support is deployed in Q2 2021 and d) modest improvements in labor markets and consumption in Q1 2021 precede a sharp rebound in Q2 and Q3. In this scenario, U.S. monthly economic output returns to pre-pandemic levels in July 2021.
- Upside Forecast: A second, more optimistic scenario is the economy grows 6.4% year-over-year in 2021. This scenario assumes: a) new COVID-19 cases fall dramatically in late Q1 2021 and social distancing policies loosen; b) vaccines are broadly available by the end of Q1 2021 and are universally available in Q2; c) $1.9 trillion in additional fiscal support is deployed in Q2; and d) meaningful improvements in unemployment result in a rebound in consumption in Q1 2021. In this scenario, U.S. monthly economic output returns to pre-pandemic levels in April 2021.
- Downside Forecast: A third, more pessimistic scenario is the U.S. economy grows 1% year-over-year in 2021. This scenario assumes a) new cases of COVID-19 rise in Q1 2021 and vaccine-resistant mutations result in a “third wave” by Q4; b) distribution of vaccines is prolonged and mutations render it ineffective; c) only $600 billion in additional stimulus is deployed in Q2; d) unemployment deteriorates and consumption contracts in Q1 2021 and again in Q4; and e) a large correction in equity markets hurts consumer and business confidence. In this scenario, U.S. monthly economic output does not recover to pre-pandemic levels until sometime in 2022.
* The Conference Board is upgrading its forecast of Q2 2021 real GDP growth from 3.6% (annualized rate) to 4.7% (annualized rate). This upgrade is due to our expectation that the U.S. government approves $1.5 trillion in fiscal support in March. Subsequent quarters are also positively impacted by the package.
Employment
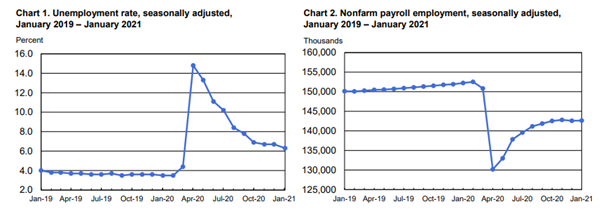
Total nonfarm payroll employment changed little in January (+49,000), with unemployment registering 6.3%, according to the U.S. Bureau of Labor Statistics reported today. The number of employed persons is 10.1 million.
“The decline in payroll employment reflects the recent increase in coronavirus (COVID-19) cases and efforts to contain the pandemic,” explained the U.S. Bureau of Labor Statistics. Other takeaways, courtesy of the Bureau’s recent reporting:
- Among the unemployed, the number of persons on temporary layoff decreased to 2.7 million in January. This measure is down considerably from the recent high of 18 million in April but remains two million higher than its February level.
- The number of permanent job losers is little changed at 3.5 million, but remains 2.2 million higher than in February.
- The number of long-term unemployed (those jobless for 27 weeks or more) remains essentially unchanged month-over-month at four million, accounting for 39.5% of the total unemployed.
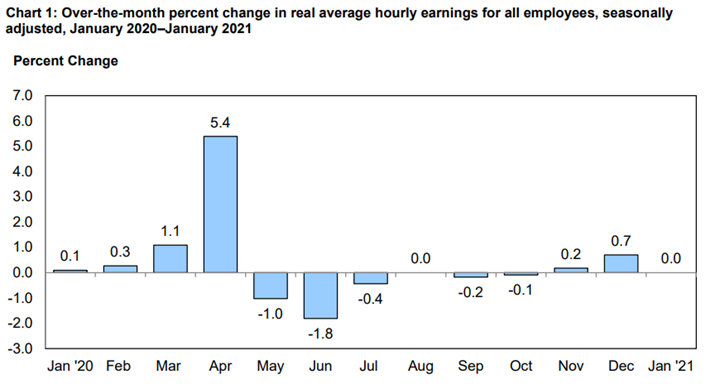
Real average hourly earnings increased 4%, seasonally adjusted, from January 2020 to January 2021. The change in real average hourly earnings combined with an increase of 2% in the average workweek resulted in a 6.1% increase in real average weekly earnings over this period.
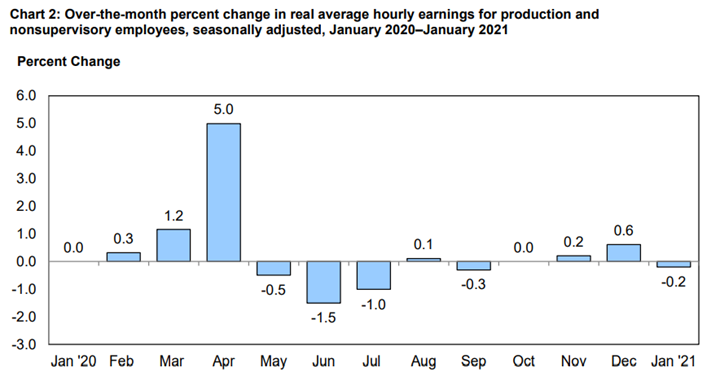
From January 2020 to January 2021, real average hourly earnings increased 3.8%, seasonally adjusted. The change in real average hourly earnings combined with a 2.4% increase in the average workweek resulted in a 6.3% increase in real average weekly earnings over this period.
By Demographic
Unemployment rates among all major worker groups in January: adult men and adult women—6%, teenagers—14.8%, Whites—5.7%, Asians—6.6%, Hispanics—8.6% and Blacks—9.2%.
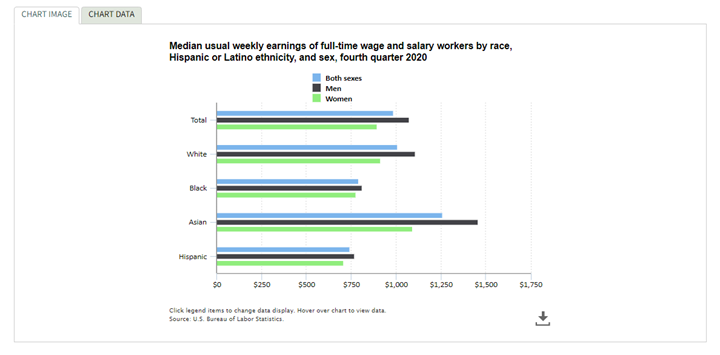
Median weekly earnings of the nation’s 111.5 million full-time wage and salary workers were $984 in the fourth quarter of 2020. Median weekly earnings for women were $894, or 83.4% of the median of $1,072 for men.
By Industry
In December, total nonfarm payroll employment declined by 140,000—following an increase of 245,000 a month prior. Those figures are little changed during January (+49,000), with unemployment hovering around 6.3%, according to the U.S. Bureau of Labor Statistics reported today.
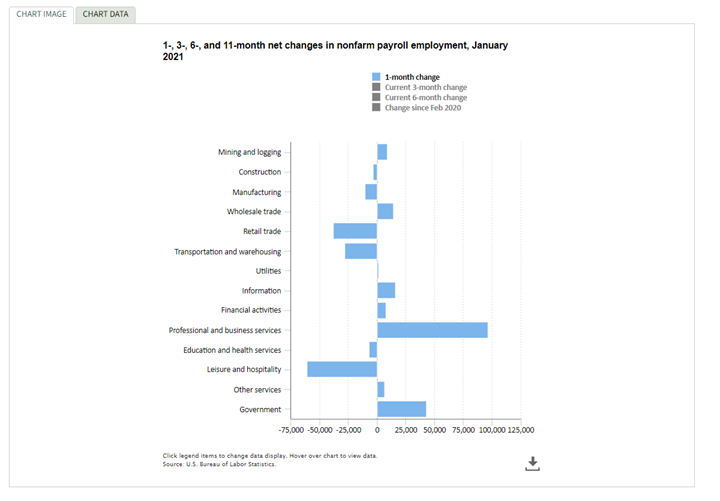
During this reporting period, notable job gains in professional and business services and public and private education were offset by losses in leisure and hospitality, retail trade, health care, as well as transportation and warehousing.
Important employment takeaways, courtesy of the U.S. Bureau of Labor Statistics:
- Employment in professional and business services rose by 97,000, with temporary help services accounting for most of the gain (+81,000). Job growth also occurred in management and technical consulting services (+16,000), computer systems design and related services (+11,000) and scientific research and development services (+10,000). These gains were partially offset by job losses in services to buildings and dwellings (-14,000) and in advertising and related services (-6,000). Since February 2020*, employment in professional and business services is down by 825,000.
- Wholesale trade added jobs (+14,000), but employment remains 263,000 below its February level.
- Employment in leisure and hospitality declined by 61,000, following a steep decline in December (-536,000). Employment edged down in amusements, gambling and recreation (-27,000) and in accommodation (-18,000). Employment in food services and drinking places continued to trend down (-19,000). Employment in leisure and hospitality fell by 8.2 million during March and April, increased by 4.9 million from May to November and then declined by 597,000 over the past two months. Since February, employment in leisure and hospitality is down by 3.9 million, or 22.9%.
- Retail trade lost 38,000 jobs in January, after adding 135,000 jobs in December. Over the month, employment declined in general merchandise stores (-38,000), electronics and appliance stores (-29,000) and non-store retailers (-15,000). These job losses were partially offset by gains in food and beverage stores (+15,000), clothing and clothing accessories stores (+15,000), as well as health and personal care stores (+14,000). Employment in retail trade is 383,000 lower than in February.
- Employment in transportation and warehousing declined by 28,000 and is 164,000 lower than in February. Job losses occurred in warehousing and storage (-17,000) and in couriers and messengers (-14,000); however, employment in these industries is higher than in February by 97,000 and 137,000, respectively. Employment in air transportation increased by 15,000 month-over-month but is 105,000 lower than in February.
- Employment in manufacturing changed little month-over-month (-10,000), following eight months of growth. Within the industry, durable goods lost 17,000 jobs. Employment in manufacturing is up by 803,000 since April but remains 582,000 lower than in February.
- Construction employment changed little month-over-month (-3,000), after increasing for eight consecutive months. However, employment in the industry is down by 256,000 since February.
*Review current housing market data.
Click here for more detailed employment information by industry.
*All February references are 2020.


