KPI — March 2021: Consumer Trends

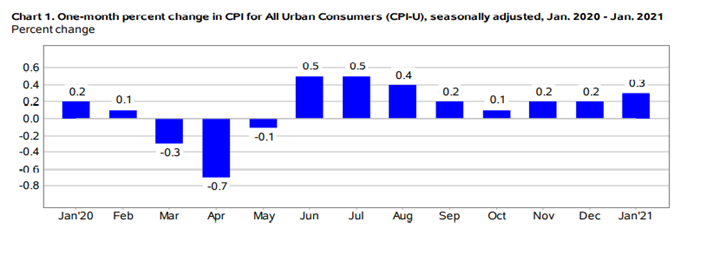
The Consumer Price Index for All Urban Consumers (CPI-U) increased .3% in January on a seasonally adjusted basis after rising .4% a month prior, according to the U.S. Bureau of Labor Statistics. Over the last 12 months, the all items index increased 1.4% before seasonal adjustment.
The gasoline index jumped 7.4%, accounting for most of the seasonally adjusted increase in the all items index. Although the indexes for electricity and natural gas declined, the energy index rose 3.5% over the month. The food index increased by .1%, as an advance in the index for food away from home more than offset a decline in the index for food at home.
Important Takeaways, Courtesy of the U.S. Bureau of Labor Statistics:
- The index for all items less food and energy was unchanged in January.
- Apparel, medical care, shelter and motor vehicle insurance posted month-over-month gains.
- Recreation, used cars and trucks, airline fares and new vehicles declined.
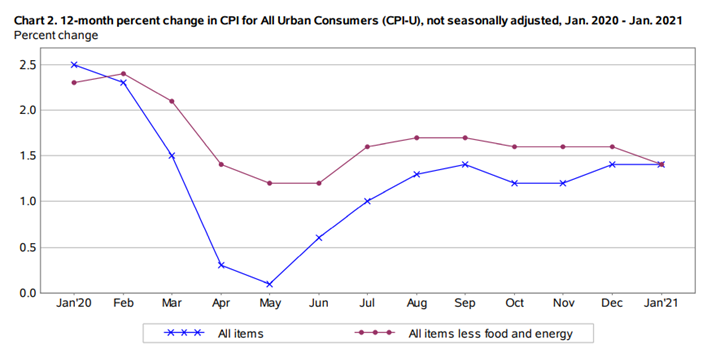
- The all items index increased 1.4% for the 12 months ending January.
- The index for all items less food and energy also rose 1.4% over the last 12 months—a smaller increase compared to the 1.6% increase for the 12 months ending December.
- The food index moved the needle 3.8% over the last 12 months.
- In contrast to these increases, and despite rising in recent months, the energy index declined 3.6% over the last year.
Consumer Sentiment & Confidence
The Consumer Sentiment Index—a survey consisting of approximately 50 core questions that cover consumers’ assessments of their personal financial situation, buying attitudes and overall economic conditions—finished at 76.8 in February, according to University of Michigan Survey of Consumers.
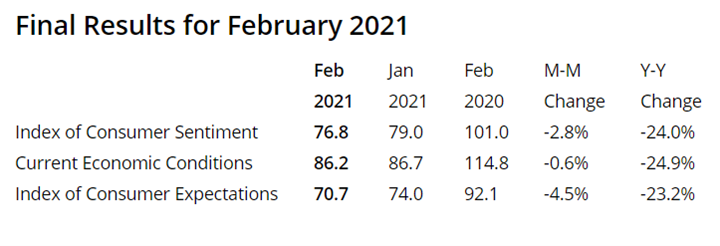
A small bump in late February was not enough to stave off a decline in consumer sentiment. Households with an income below $75,000 reported unfavorable assessments in “future economic prospects,” said Richard Curtin, chief economist for the University of Michigan Survey of Consumers.
Within the Index, “Perhaps the most attention has been garnered by rising inflationary expectations,” he continued. “The year ahead inflation rate was expected to be 3.3% in February, up from 3.0% last month and 2.5% in December.”
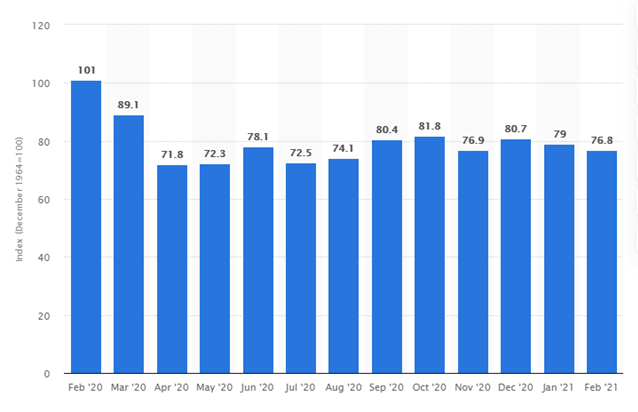
This statistic shows the U.S. Consumer Sentiment Index from February 2020 to February 2021. The index is normalized to have a value of 100 in December 1964 and based on a monthly survey of consumers, conducted in the continental United States. It consists of about 50 core questions that cover consumers’ assessments of their personal financial situation, their buying attitudes and overall economic conditions. The Consumer Sentiment Index stood at 76.8 in February 2020.
While consumer sentiment posted a month-over-month decline, The Conference Board Consumer Confidence Index® improved in February. The Index now stands at 91.3 (1985=100), up from 88.9 in January.
“After three months of consecutive declines in the Present Situation Index, consumers’ assessment of current conditions improved in February,” said Lynn Franco, senior director of economic indicators at The Conference Board. “This course reversal suggests economic growth has not slowed further. While the Expectations Index fell marginally in February, consumers remain cautiously optimistic, on the whole, about the outlook for the coming months. Notably, vacation intentions—particularly, plans to travel outside the U.S. and via air—saw an uptick this month, and are poised to improve further as vaccination efforts expand.”
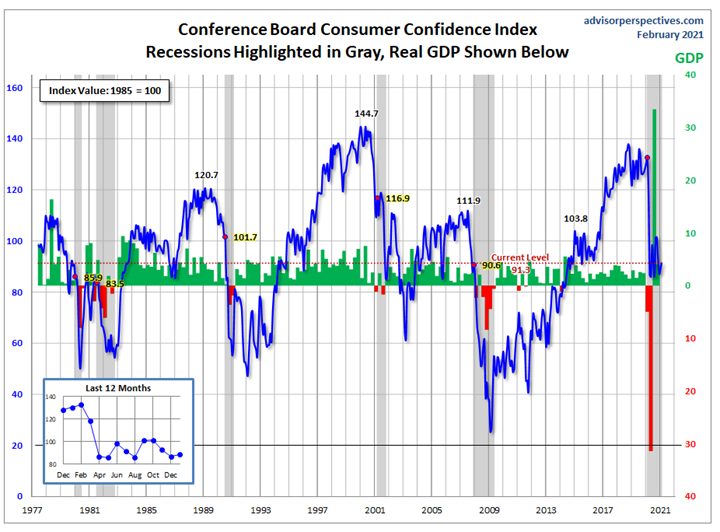
Jill Mislinski of Advisor Perspectives— a leading interactive publisher for Registered Investment Advisors (RIAs), wealth managers and financial advisors—put the recent consumer sentiment report into larger historical context as a coincident indicator of the economy. “Toward this end, we have highlighted recessions and included GDP. The regression through the index data shows the long-term trend and highlights the extreme volatility of this indicator. Statisticians may assign little significance to a regression through this sort of data. But the slope resembles the regression trend for real GDP shown below, and it is a more revealing gauge of relative confidence than the 1985 level of 100 that the Conference Board cites as a point of reference,” she noted.
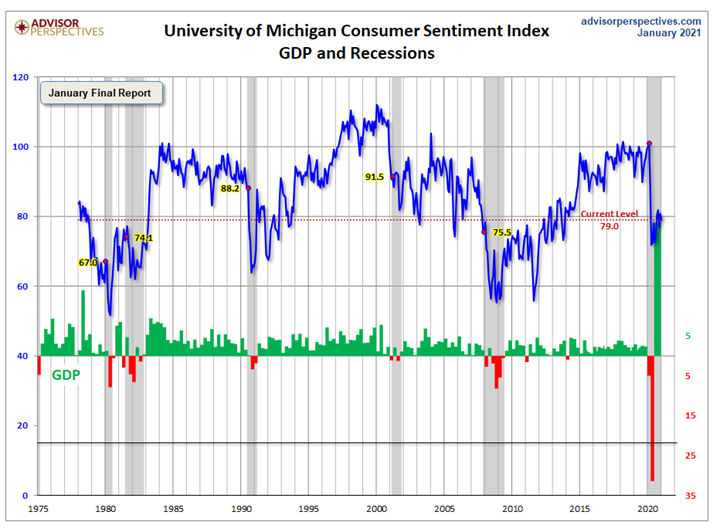
This is a long-term perspective on this widely-watched indicator. Recessions and real GDP are included to help evaluate the correlation between the Michigan Consumer Sentiment Index and the broader economy, explained Advisor Perspectives.
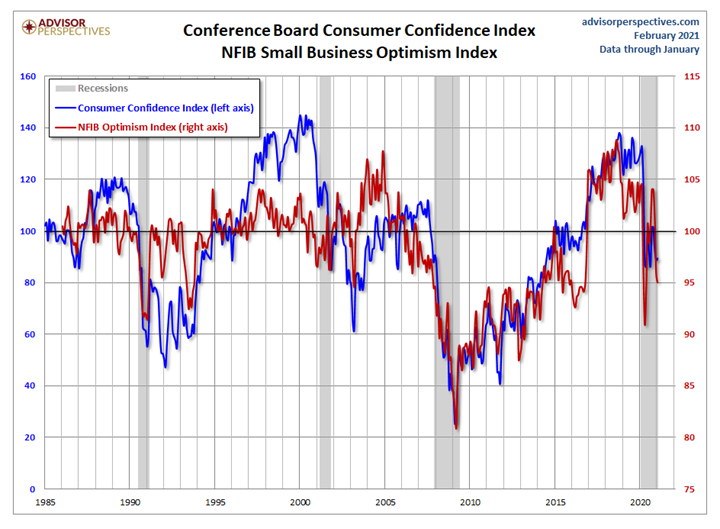
The prevailing mood of the Michigan survey is presented alongside the mood of small business owners, as captured by the NFIB Business Optimism Index (monthly update here).
Consumer Spending
The National Retail Federation’s (NRF) calculation of retail sales, which excludes automobile dealers, gasoline stations and restaurants, posted a 5.9% month-over-month gain (seasonally adjusted) in January and a 10.7% year-over-year increase (unadjusted).
“January’s retail sales numbers reflect a very strong start for consumers and retailers as we look ahead to a critical year curbing the global pandemic and strengthening our economic recovery,” said Matthew Shay, NRF President and CEO.
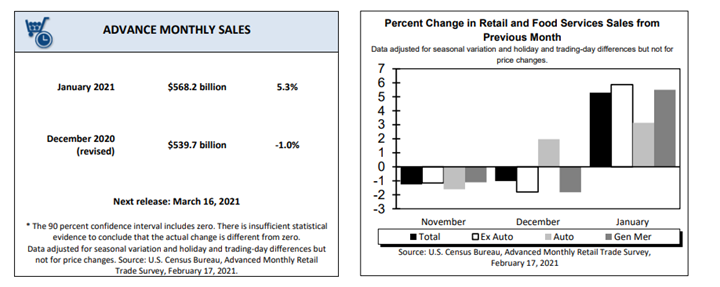
Advance estimates of U.S. retail and food services sales for January 2021, adjusted for seasonal variation and holiday and trading-day differences but not for price changes, were $568.2 billion, an increase of 5.3% (±0.5%) from the previous month, and 7.4% (±0.7%) above January 2020. Total sales for the November 2020 through January 2021 period were up 4.6% (±0.5%) from the same period a year ago. The November 2020 to December 2020 percent change was revised from down 0.7% (±0.5%) to down 1% (±0.3%).
Furthermore, these gains build on momentum seen during the November-December holiday season, when retail sales as calculated by NRF grew 8% year-over-year to a record $787.1 billion, even after being revised down from a preliminary estimate of $789.4 billion.
“There was none of the falloff in spending that we often find post-holiday and the increase was even better than expected,” added Jack Kleinhenz, NRF chief economist. “There is plenty of purchasing power available for most consumers, and the pickup in shopping has even been reflected in the number of hours worked by retail employees.”
Consumers—and the economy at large remain “in good shape despite unprecedented adversity over the past year,” said Kleinhenz. In fact, 2020 recorded a 6.7% bump in retail sales over 2019.
“Confidence is building thanks to the availability of COVID-19 vaccines and states and local governments are beginning to remove restrictions on economic activity. Going forward, I expect consumer spending to build on this momentum,” confirmed Shay.
Click here to review retail category details for January.
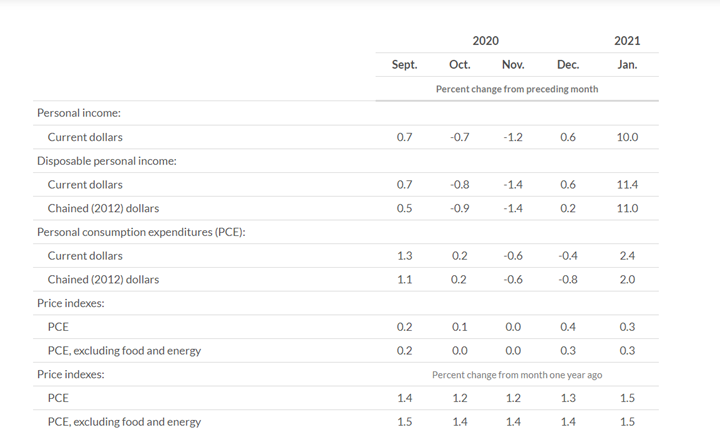
Personal income increased $1,954.7 billion (10%) in January, according to the U.S. Bureau of Economic Analysis. Real DPI rose 11% and Real PCE 2%. Disposable personal income (DPI) increased $1,963.2 billion (11.4%), personal consumption expenditures (PCE) moved to $340.9 billion (2.4%) and personal outlays increased $348.7 billion. Personal saving was $3.93 trillion in January and the personal saving rate—personal saving as a percentage of disposable personal income—was 20.5%. Review the most current report detail here.


