KPI — June 2023: State of Business

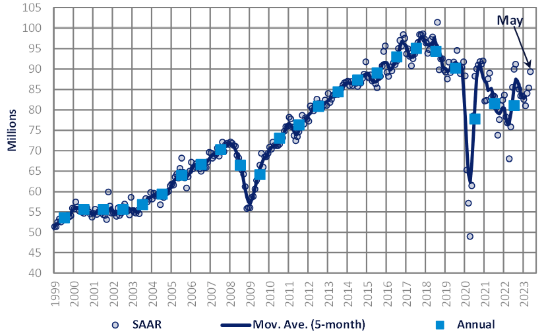
LMC Automotive reports Global Light Vehicle (LV) sales volume rose to 89 million units per year in May, up four million units per year month-over-month. Light vehicle registration volumes are rebounding, with global sales up 7.4 million units (+18.7% YoY). All Western European countries reported growth as their markets continue to bounce back from devastating supply chain issues. While U.S. light-vehicle sales grew 23.5%, China outperformed the competition at 29.6 million units per year.
“Risk is balanced overall, but there remains some upside potential in 2023 if major markets avoid a recession or consumers show further resilience. There is some mild risk that volume has been pulled forward given expectations for an economic slowdown being delayed until late 2023 or early 2024. The outlook for 2024 global light-vehicle sales is currently holding at 90.3 million units, an increase of 4.9% from 2023,” says Jeff Schuster, president of global forecasts at LMC Automotive.
State of Manufacturing
Economic activity in the manufacturing sector contracted in May for the seventh consecutive month following a 28-month period of growth, according to the nation’s supply executives in the latest Manufacturing ISM® Report On Business®. The May Manufacturing PMI® registered 46.9%, 0.2 percentage point lower than April.
“The U.S. manufacturing sector shrank again, with the Manufacturing PMI® losing a bit of ground compared to the previous month, indicating a faster rate of contraction. The May composite index reading reflects companies continuing to manage outputs to better match demand for the first half of 2023 and prepare for growth in the late summer/early fall period. However, there is clearly more business uncertainty in May,” says Timothy R. Fiore, CPSM, C.P.M., chair of the Institute for Supply Management® (ISM®) Manufacturing Business Survey Committee.
Important takeaways, Courtesy of the Manufacturing ISM® Report On Business®:
- Demand eased again, with the (1) New Orders Index contracting at a faster rate, (2) New Export Orders Index slightly improving to 50%, (3) Customers’ Inventories Index persisting at the low end of “too high” territory (a negative for future production) and (4) Backlog of Orders Index dropping to a level not seen since the Great Recession.
- Output/Consumption (measured by the Production and Employment indexes) was positive, with a combined 3.4-percentage point upward impact on the Manufacturing PMI® calculation.
- The Employment Index expanded for the second month (and at a faster rate) after two months of contraction, and the Production Index moved back into expansion territory. Regarding employment, panelists’ comments continue to indicate near equal levels of activity toward expanding and contracting head counts at their companies, amid mixed sentiment about when significant growth will return.
- Inputs – defined as supplier deliveries, inventories, prices and imports – continue to accommodate future demand growth. The Supplier Deliveries Index indicated faster deliveries, while the Inventories Index dropped further into contraction as panelists’ companies manage inventories exposure.
- The Prices Index fell back into “decreasing” territory (and in dramatic fashion) after one month of increasing prices. Manufacturing lead times clearly improved.
U.S. New Vehicle Sales
Total new-vehicle sales for May 2023, including retail and non-retail transactions, are projected to reach 1,337,700 units – a 15.6% year-over-year increase, according to a joint forecast from J.D. Power and LMC Automotive.
“The industry is positioned for another strong month in May as retail sales are estimated to surge 9.6% from a year ago,” says Thomas King, president of the data and analytics division at J.D. Power. “This positive performance is complemented by a projected 0.7% increase in average transaction prices. As a result, it is anticipated that consumers will spend nearly $47 billion on the purchase of new vehicles in May, showcasing a significant 13% growth from a year ago.”
In addition, OEMs are allocating more production volume to fleet sales, which are predicted to total 258,500 units in May – a 49.6% year-over-year boost on a selling day adjusted basis. Overall volume is expected to account for 19% of total light-vehicle sales, up from 15% compared to last year.
Important Takeaways, Courtesy of J.D. Power:
- Retail buyers are on pace to spend $46.9 billion on new vehicles, up $5.5 billion year-over-year.
- Truck/SUVs are on pace to account for 79.1% of new vehicle retail sales in May.
- The average new vehicle retail transaction price in May is expected to reach $45,838, a 0.7% year-over-year increase. The previous high for any month was $47,362, set in December 2022.
- Average interest rates for new-vehicle loans are expected to swell to 7%, 206 basis points higher than a year ago.
- Total retailer profit per unit, which includes grosses and finance and insurance income, is expected to reach $3,732. While this is 25.8% lower than a year ago, it is still more than double the amount in May 2019.
“In June, key metrics to monitor include inventory levels, pricing and interest rates. Despite the challenges posed by elevated interest rates and pricing, sales volume and transaction prices have displayed remarkable resilience, enabled by the combination of improved vehicle availability and pent-up demand. If most interest rate increases have already occurred, consumers can anticipate excluding this factor from future monthly payment increases, potentially sustaining demand.”
U.S. Used Market
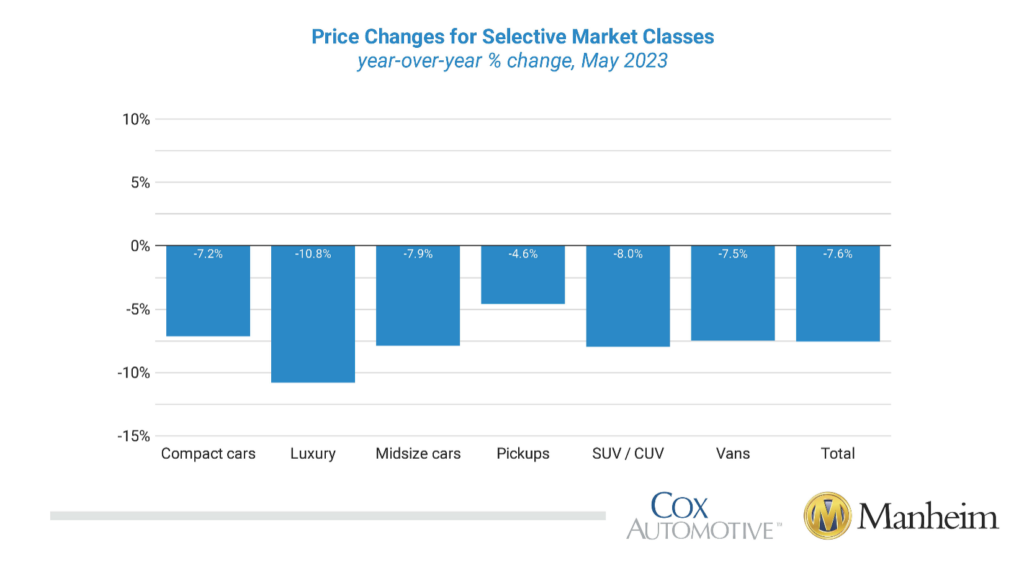
Wholesale used-vehicle prices (on a mix, mileage and seasonally adjusted basis) decreased 2.7% month-over-month in May. The Manheim Used Vehicle Value Index (MUVVI) declined to 224.5, down 7.6% from a year ago.
According to Manheim, major market segments posted seasonally adjusted prices that were down year-over-year. Compared to May 2022, pickups, compact cars and vans “lost less” compared to the rest of the industry at 4.6%, 7.2% and 7.5%, respectively. The luxury segment declined 10.8%, while SUVs and mid-size cars were down 8% and 7.9%, respectively. Vans increased by 0.2% month-over-month, while compact and midsize cars declined by 2.4% each. SUVs were flat versus April, with luxury and pickups down 3% and 4.3%, respectively.
Used vehicle price declines are resulting in less trade-in equity for new-vehicle buyers. Currently, JD Power says the average trade-in equity is approximately $9,462, down $247 from a year ago and $613 since the peak in June 2022. For context: trade equity is more than double the pre-pandemic level, thus helping owners with a vehicle to trade in offset some of the pricing and interest rate hikes.
KPI — June 2023: Recent Vehicle Recalls
Key Performance Indicators Report — June 2023


