KPI — June 2022: Consumer Trends
The Conference Board Consumer Confidence Index® decreased slightly in May, following a small increase in April. The Index now stands at 106.4 (1985=100), down from 108.6 in April (after an upward revision). The Present Situation Index – based on consumers’ assessment of current business and labor market conditions –declined to 149.6 from 152.9 last month. The Expectations Index – based on consumers’ short-term outlook for income, business and labor market conditions – declined to 77.5 from 79.
The decline in the Present Situation Index was driven solely by a perceived softening in labor market conditions, says Lynn Franco, senior director of economic indicators at The Conference Board. By contrast, she says views of current business conditions improved, a data point seemingly in direct conflict with The NFIB Small Business Optimism Index and Survey for Consumers.
In addition, consumers notably cooled large purchases like cars, homes and major appliances. The Conference Board reports it is likely a reflection of rising interest rates, plus consumers pivoting from “big-ticket items” to spending on services. Overall, Franco says the Present Situation Index remains strong, suggesting growth did not contract further in Q2. With the Expectations Index weakening further, however, consumers sense the economy is stalled.
In January 2021, when President Joe Biden took office, the inflation rate was 1.4% – below the target set by the Federal Reserve. After the passage of the American Rescue Plan, however, which effectively secured $1.9 trillion in additional government spending, the inflation rate nearly tripled in a four-month span and hit 4.16% by April. At the time, President Biden dismissed economic fears and took a “transitory” approach to a bloating inflation rate. While it hovered at 5.2% – 5.3% between July and October 2021, it swelled to 7.48% by January 2022 – before Russia’s invasion of Ukraine. In April, it climbed to 8.25% and, most recently, 8.582% in May.
“Indeed, inflation remains top of mind for consumers, with their inflation expectations in May virtually unchanged from April’s elevated levels,” she says. “Looking ahead, expect surging prices and additional interest rate hikes to pose continued downside risks to consumer spending this year.”
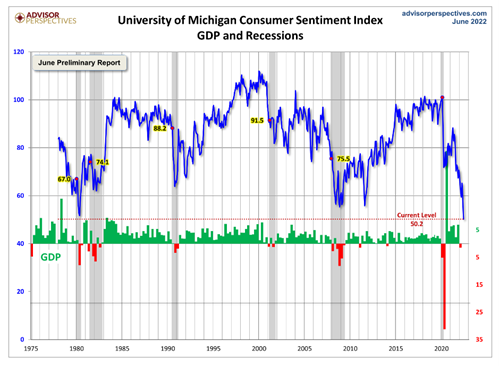
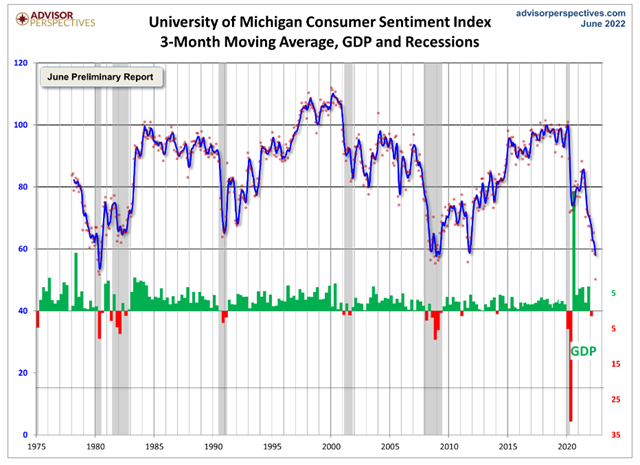
The chart evaluates the historical context for this index as a coincident indicator of the economy. Toward this end, Advisor Perspectives highlighted recessions and included GDP. To put the reporting into greater perspective, consumer sentiment is 41.4% below the average reading (arithmetic mean) and 40.7% below the geometric mean. The current index level is at the null percentile of the 534 monthly data points in this series. Note that this indicator is considered somewhat volatile, with a three-point absolute average monthly change. The latest data point saw an 8.2 point decrease from the previous month.
Similarly, The Consumer Sentiment Index – a survey consisting of approximately 50 core questions covering consumers’ assessments of their personal financial situation, buying attitudes and overall economic conditions –declined to 58.4 in May, according to the University of Michigan Survey of Consumers.
Currently, consumer sentiment is trending down 14% since May, continuing a downward spiral over the last year and reaching its lowest recorded value – “comparable only to the trough reached in the middle of the 1980 recession,” notes Surveys of Consumers. Director Joanne Hsu says all components of the sentiment index fell, with the steepest decline in the year-ahead outlook in business conditions, down 24% from May.
Furthermore, consumers’ assessments of their personal financial situation worsened approximately 20%. Forty-six percent of consumers attributed their negative views to inflation, up from 38% in May. According to Survey of Consumers, this share has only been exceeded once since 1981, during the Great Recession.
Consumer Income & Spending
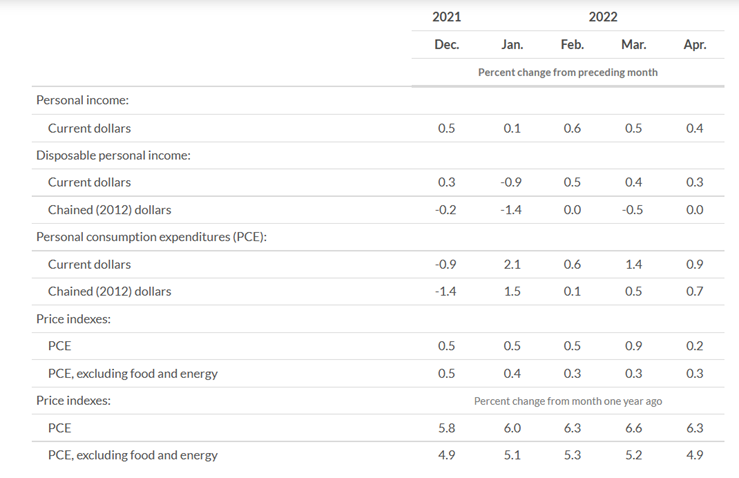
According to the U.S. Bureau of Economic Analysis (BEA), personal income increased $89.3 billion (.4%) in April 2022. Disposable personal income (DPI) increased $48.3 billion (.3%) and personal consumption expenditures (PCE) increased $152.3 billion (.9%). Real DPI increased less than .1% in April and Real PCE increased .7%. Meanwhile, goods increased 1% and services increased .5%. Excluding food and energy, the PCE price index increased .3%.
Important Takeaways, Courtesy of BEA:
- The $152.3 billion increase in current-dollar PCE reflected an increase of $48.6 billion in spending for goods and a $103.7 billion increase in spending for services.
- Within goods, increases were widespread across all components except for gasoline and other energy goods; spending for motor vehicles and parts was the leading contributor to the increase.
- Within services, increases also were widespread across all components – led by food services and accommodations, as well as housing and utilities.
- Personal outlays increased $155.3 billion in April, while personal saving was $815.3 billion and the personal saving rate – personal saving as a percentage of disposable personal income – registered 4.4%.
- The PCE price index for April increased 6.3% from one year ago, reflecting increases in both goods and services. Energy prices increased 30.4% and food prices climbed to 10%. Excluding food and energy, the PCE price index for April increased 4.9% from one year ago.
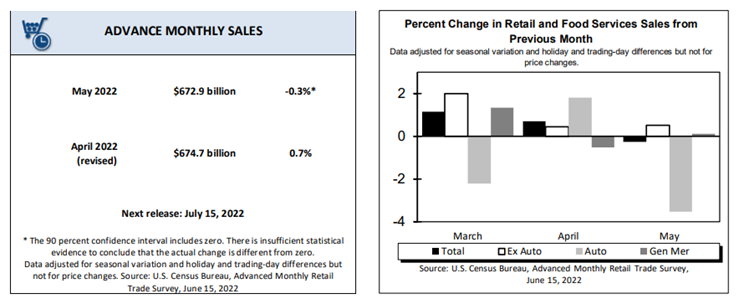
According to the U.S. Census Bureau, advance estimates of U.S. retail and food services sales for May 2022 – adjusted for seasonal variation, holiday and trading-day differences, but not for price changes – were $672.9 billion. It is a decrease of .3% (±.5%)* from the previous month but 8.1% (±.7%) above May 2021. Total sales for the March 2022 through May 2022 period rose 7.7% (±.7%) year-over-year. The March 2022 to April 2022 percent change was revised from up .9% (±.5%) to up .7% (±.2%). Retail trade sales declined .4% (±.4%)* compared to April 2022 but increased 6.9% (±.7%) year-over-year. Gasoline stations increased 43.2% (±1.6%) year-over-year, while food services and drinking places were up 17.5% (±4%).
Key Performance Indicators Report — June 2022


