KPI — June 2021: State of the Economy

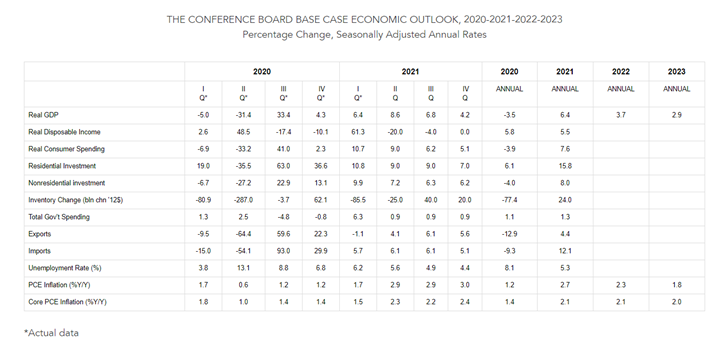
The Conference Board forecasts real GDP growth in the U.S. will rise to 8.6% (annualized rate) in Q2 2021 and 6.4% (year-over-year) in 2021.* “The primary driver of this rapid expansion will be a surge in consumer spending as the economy fully reopens. High and increasing vaccination rates and low new COVID-19 case numbers indicate that the reopening process may be complete for much of the country by the end of the summer,” according to The Conference Board.
Following a robust recovery in 2021, economic growth is expected to be 3.7% (year-over-year) in 2022 and 2.9% (year-over-year) in 2023. Such rapid acceleration in growth is shining a light on rising inflation.
“Presently, we forecast inflation will peak in Q4 2021 with the price level for personal consumption expenditures (PCE) – the US Federal Reserve’s preferred inflation metric – rising to 3% (year-over-year) and Core PCE inflation rising to 2.4% (year-over-year),” noted The Conference Board.
It is unclear whether the Federal Reserve will tolerate inflation rising to these rates for an extended period of time. However, inflation pressure should abate as U.S. economic growth returns to a more natural rate in 2022 and 2023, according to The Conference Board.
All data and analysis are courtesy of The Conference Board.
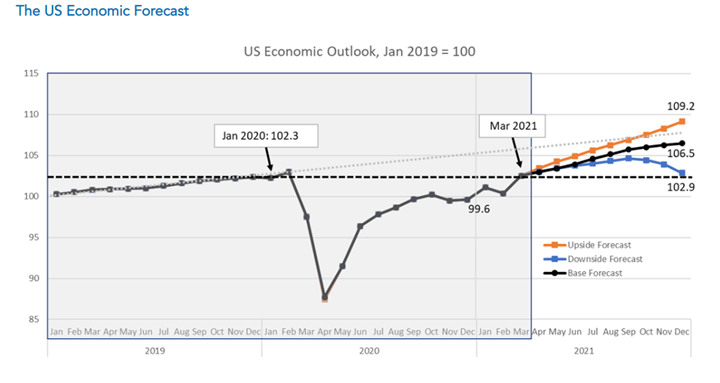
The Conference Board generated three potential recovery scenarios based on specific sets of assumptions:
- Base Forecast: Forecasts place real GDP growth in the U.S. at 8.6% (annualized rate) in Q2 2021 and 6.4% (year-over-year) in 2021* Following a robust recovery in 2021, economic growth is estimated to be 3.7% (year-over-year) in 2022 and 2.9% (year-over-year) in 2023. The Conference Board views this scenario as the most probable, assuming a) new cases of COVID-19 continue to decline over the coming months and most social distancing restrictions are retracted by the end of the summer; b) COVID-19 vaccinations become broadly available in Q2 2021 and are available on-demand by early Q3 2021; and c) continued improvements in labor markets and consumption in Q2 2021 and Q3 2021.
- Upside Forecast: Alternatively, a more optimistic scenario shows the economy could grow 7.4% (year-over-year) in 2021, assuming a) new cases of COVID-19 fall dramatically in May and June and most social distancing policies are eliminated before the summer; b) vaccines are available on-demand in Q2 2021; c) the Administration’s $2.3 trillion infrastructure and tax plan is passed by Q3 2021 and begins to hit the economy before the end of 2021; and d) faster than expected improvements in labor markets and consumption in Q2 2021.
- Downside Forecast: A more pessimistic scenario could result in only 5.5% growth (year-over-year) in 2021, assuming a) new cases of COVID-19 rise as vaccine-resistant mutations result in an additional wave in Q4 2021; b) the production and distribution of vaccines is disrupted while mutations render them ineffective; c) the Federal Reserve signals that it will begin to raise rates earlier than anticipated; d) unemployment deteriorates and the consumption recovery stagnates; and e) a large correction in equity markets hurts consumer and business confidence.
Employment
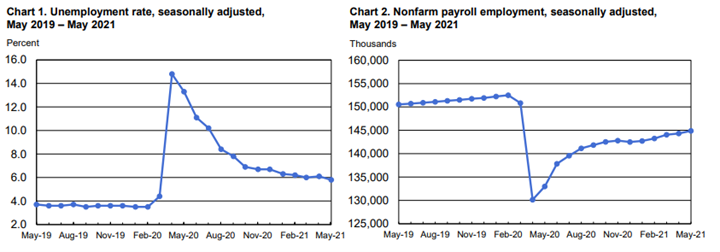
Total nonfarm payroll employment increased by 559,000 in May – following increases of 278,000 in April and 785,000 in March. While May figures came in below an estimated 671,000, they are significantly higher than the month prior.
The national unemployment rate currently stands at 5.8%, according to the U.S. Bureau of Labor Statistics.
Important Takeaways, Courtesy of the Bureau of Labor Statistics
- Among the unemployed, the number of people on temporary layoff declined by 291,000 to 1.8 million in May. This measure is down considerably from the recent high of 18 million in April 2020 but remains 1.1 million higher than in February 2020.
- The number of permanent job losers decreased by 295,000 to 3.2 million but remains 1.9 million higher than in February 2020.
- The number of long-term unemployed (those jobless for 27 weeks or more) declined by 431,000 to 3.8 million but remains 2.6 million higher than in February 2020. *Long-term unemployed accounted for 40.9% of the total unemployed in May, despite the number of job openings reaching a series high of 9.3 million on the last business day of April.
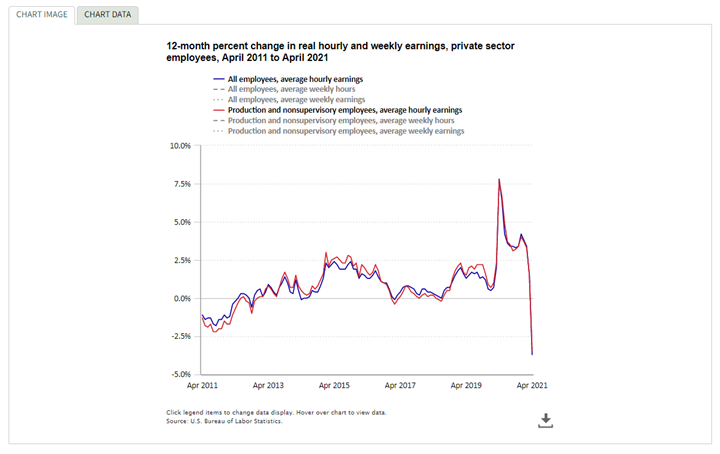
Real average hourly earnings decreased 3.7% from April 2020 to April 2021. The change in real average hourly earnings combined with an increase of 2.3% in the average workweek resulted in a 1.4% decrease in real average weekly earnings over this period. From April 2020 to April 2021, real average hourly earnings decreased 3.4% for production and nonsupervisory employees. The change in real average hourly earnings combined with a 2.7% increase in the average workweek resulted in a .8% decrease in real average weekly earnings over the year.
By Demographic
Unemployment rates among all the major worker groups in May: adult men – 5.9%, adult women – 5.4%, teenagers – 9.6%, Whites – 5.1%, Asians – 5.5%, Hispanics – 7.3% and Blacks – 9.1%.
Unemployment rates among all major worker groups in April: adult men – 6.1%, adult women – 5.6%, teenagers – 12.3%, Whites – 5.3%, Asians – 5.7%, Hispanics – 7.9% and Blacks – 9.7%.
*Reporting shows a decline in unemployment across every major demographic during the month of May.
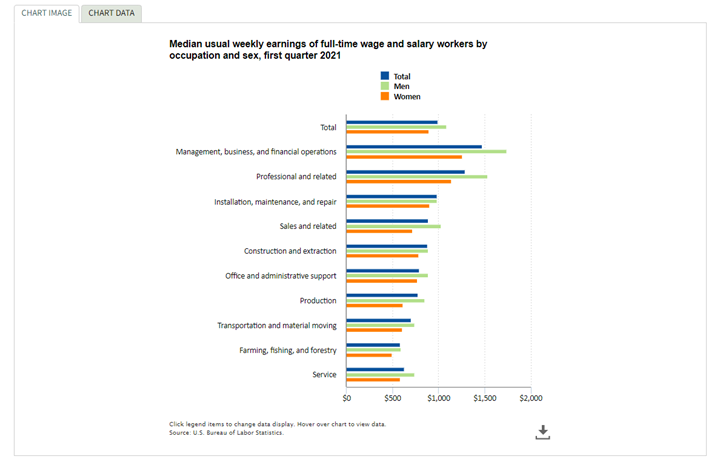
Median weekly earnings of the nation’s 112.1 million full-time wage and salary workers were $989 in the first quarter of 2021, according to the U.S. Bureau of Labor Statistics. Women reported median weekly earnings of $900, or 82.6% of the $1,089 median for men. Full-time workers in management, business and financial operations occupations posted the highest median weekly earnings—$1,741 for men and $1,261 for women. Men and women employed in farming, fishing and forestry jobs had the lowest median weekly earnings in the first quarter of 2021, at $596 and $499, respectively. The ratio of women’s earnings to men’s earnings was highest in installation, maintenance and repair occupations (91.7%).
By Industry
Though total nonfarm payroll employment increased by 559,000 in May, it remains down 7.6 million, or 5%, compared to pre-pandemic levels.
“The labor market needs to gain 8.2 million jobs to put us back where we were pre-pandemic, not accounting for the jobs that would have been created if the pandemic never happened. Every month job gains don’t accelerate puts us further behind,” explained Nick Bunker, economic research director at Indeed Hiring Lab.
The May Employment Situation Summary presents a snapshot of job gains per industry alongside comparison data that illustrates how said job gains stack up against pre-pandemic levels.
May’s increase was driven by the leisure and hospitality industry, which posted 292,000 jobs, mostly in food and drinking (+86,000). However, overall, the sector is down 2.5 million jobs, or 15%, compared to pre-pandemic. This indicates the jobs created were not “new,” rather pre-existing positions that had been vacated as a result of COVID restrictions.
Employment also increased in public and private education, reflecting the continued resumption of in-person learning and other school-related activities in some parts of the country – albeit the significant rise in employment comes as said schools are preparing for summer break: local government education (+53,000), state government education (+50,000) and private education (+41,000). However, employment is down from February 2020 levels in local government education (-556,000), state government education (-244,000) and private education (-293,000).
Important Takeaways, Courtesy of the U.S. Bureau of Labor Statistics
- Employment in manufacturing rose by 23,000 in May. A job gain in motor vehicles and parts (+25,000) followed a loss in April (-38,000). Employment in manufacturing is down by 509,000 from its level in February 2020.
- Employment in wholesale trade increased by 20,000 in May, mostly in the durable goods component (+14,000). Employment in wholesale trade is down by 211,000 since February 2020.
- Employment in health care and social assistance added 46,000 jobs in May. Employment in health care continued to trend up (+23,000), reflecting a gain in ambulatory health care services (+22,000). Social assistance added 23,000 jobs over the month, largely in child daycare services (+18,000). Compared with February 2020, employment is down by 508,000 in health care and by 257,000 in social assistance.
- Employment in retail trade changed little in May (-6,000). Clothing and clothing accessories stores added 11,000 jobs. Employment in food and beverage stores decreased by 26,000, following a decline of 47,000 in April. Employment in retail trade is 411,000 below its February 2020 level.
- Construction employment edged down in May (-20,000), reflecting a job loss in nonresidential specialty trade contractors (-17,000). Employment in construction is 225,000 lower than in February 2020.
By Geography
Unemployment rates were lower in April across 12 states (+ District of Columbia) and stable in 38 states, according to the U.S. Bureau of Labor Statistics. Forty-eight states and the District recorded jobless rate decreases from a year earlier and two states posted little change.
Nonfarm payroll employment increased in nine states (+ District of Columbia), decreased in two states and was essentially unchanged in 39 states during April 2021. Over the year, nonfarm payroll employment increased in all states and the District.
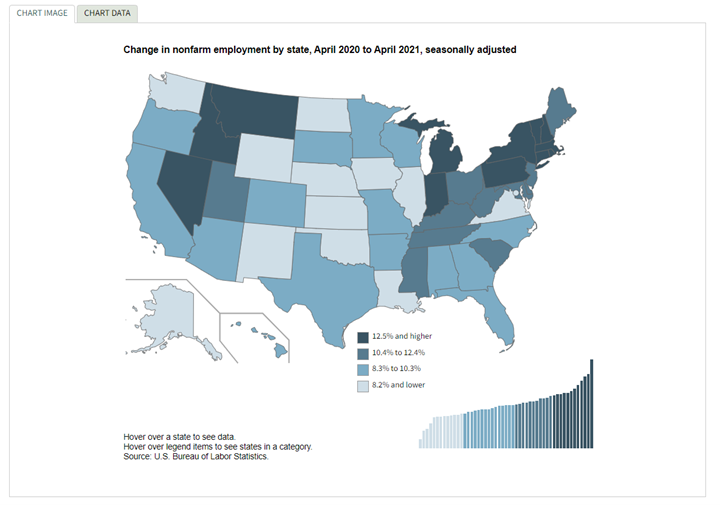
Hawaii had the highest unemployment rate in April at 8.5%, followed by California (8.3%), as well as New Mexico and New York (8.2% each). Nebraska, New Hampshire, South Dakota and Utah presented the lowest rates at 2.8% each. In total, 27 states posted unemployment rates lower than the U.S. figure at the time (6.1%), 11 states (+ District of Columbia) had higher rates and 12 states were not appreciably different from that of the nation.