KPI — June 2021: Consumer Trends
The Consumer Price Index for All Urban Consumers (CPI-U) increased .6% in May on a seasonally adjusted basis after rising .8% in April, according to the U.S. Bureau of Labor Statistics. Over the last 12 months, the all items index increased 5% before seasonal adjustment – the largest 12-month increase since a 5.4% increase in August 2008.
Important takeaways, courtesy of the U.S. Bureau of Labor Statistics:
- The index for used cars and trucks continued to rise, increasing 7.3%; this accounts for approximately one-third of the seasonally adjusted all items increase.
- The food index increased .4%, the same increase as in April.
- The energy index was unchanged, with a decline in the gasoline index again offsetting increases in the electricity and natural gas indexes.
- The index for all items less food and energy rose .7% after increasing .9% in April.
- The all items index has been trending up every month since January when the 12-month change was 1.4%. The index for all items less food and energy rose 3.8% over the last 12-months – the largest 12-month increase since the period ending June 1992. The energy index rose 28.5% over the last 12-months, and the food index increased 2.2%.
Consumer Sentiment & Confidence
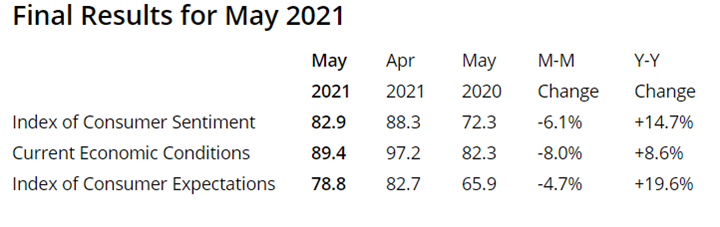
The Consumer Sentiment Index – a survey consisting of approximately 50 core questions that cover consumers’ assessments of their personal financial situation, buying attitudes and overall economic conditions – finished at 82.9 in May, below its 88.3 reading in April.
May is the lowest consumer confidence level in three months, amid declines in both current conditions (89.4 vs 97.2 in April) and expectations (78.8 vs 82.7), according to the University of Michigan Survey of Consumers. Meanwhile, inflation expectations remain elevated for the year ahead (4.6% vs 3.4%) and the next five years (3% vs 2.7%).
“It is hardly surprising that the resurgent strength of the economy produced more immediate gains in demand than supply, causing consumers to expect a surge in inflation,” said Richard Curtin, chief economist at Survey for Consumers. “Record proportions of consumers reported higher prices across a wide range of discretionary purchases, including homes, vehicles and household durables – the average change in May vastly exceeds all prior monthly changes.”
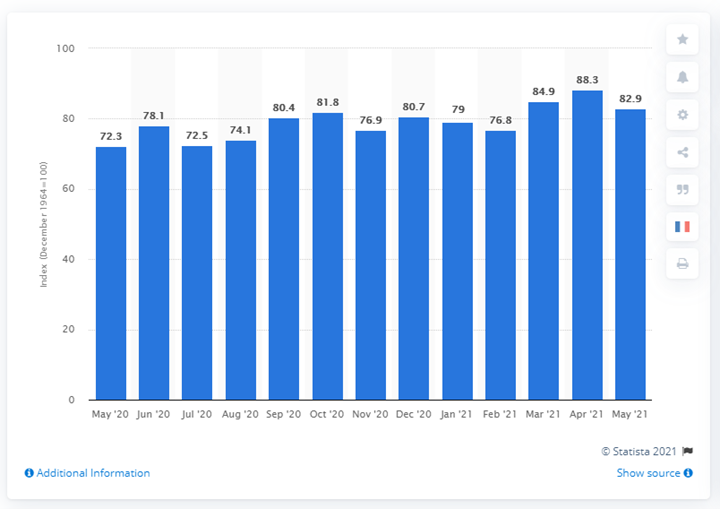
This statistic shows the U.S. Consumer Sentiment Index from May 2020 to May 2021. The index is normalized to have a value of 100 in December 1964 and based on a monthly survey of consumers, conducted in the continental U.S. It consists of about 50 core questions, which cover consumers’ assessments of their personal financial situation, buying attitudes and overall economic conditions. The Consumer Sentiment Index stood at 82.9 in May 2021.
Furthermore, after a modest increase in February and a “surge” in March and April, The Conference Board Consumer Confidence Index® held steady in May. The Index now stands at 117.2 (1985=100), down marginally from 117.5 in April.
“Consumers’ assessment of present-day conditions improved, suggesting economic growth remains robust in Q2,” said Lynn Franco, senior director of economic indicators at The Conference Board. “However, consumers’ short-term optimism retreated, prompted by expectations of decelerating growth and softening labor market conditions in the months ahead. Consumers were also less upbeat this month about their income prospects – a reflection, perhaps, of both rising inflation expectations and a waning of further government support until expanded Child Tax Credit payments begin reaching parents in July. Overall, consumers remain optimistic, and confidence should remain resilient in the short term, as vaccination rates climb, COVID-19 cases decline further and the economy fully reopens,” she added.
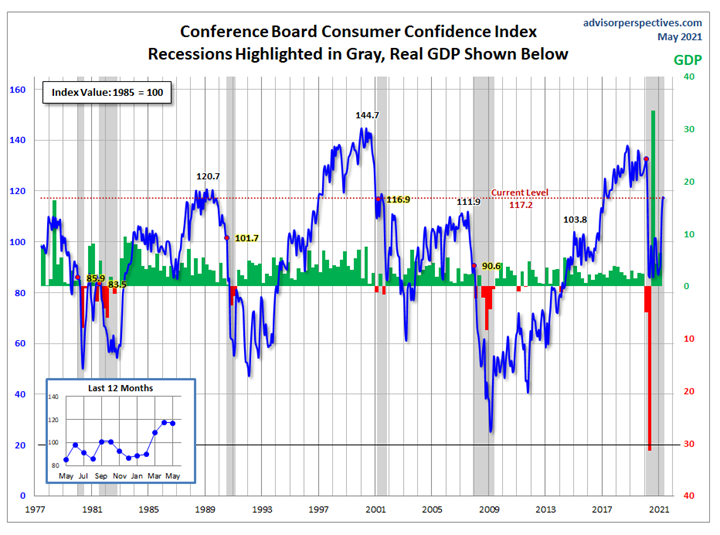
Jill Mislinski of Advisor Perspectives – a leading interactive publisher for Registered Investment Advisors (RIAs), wealth managers and financial advisors – put the recent consumer sentiment report into larger historical context as a coincident indicator of the economy. “Toward this end, we have highlighted recessions and included GDP. The regression through the index data shows the long-term trend and highlights the extreme volatility of this indicator. Statisticians may assign little significance to a regression through this sort of data. But the slope resembles the regression trend for real GDP shown below, and it is a more revealing gauge of relative confidence than the 1985 level of 100 that the Conference Board cites as a point of reference,” she explained.
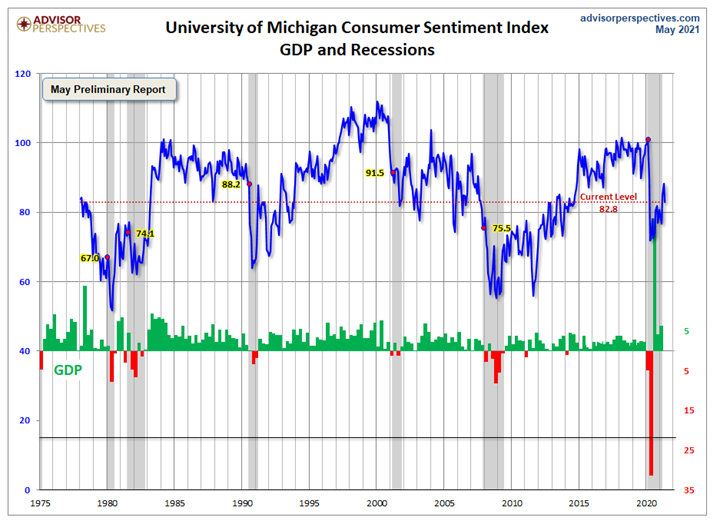
This is a long-term perspective on a widely-watched indicator. Recessions and real GDP are included to help evaluate the correlation between the Michigan Consumer Sentiment Index and the broader economy, according to Advisor Perspectives.
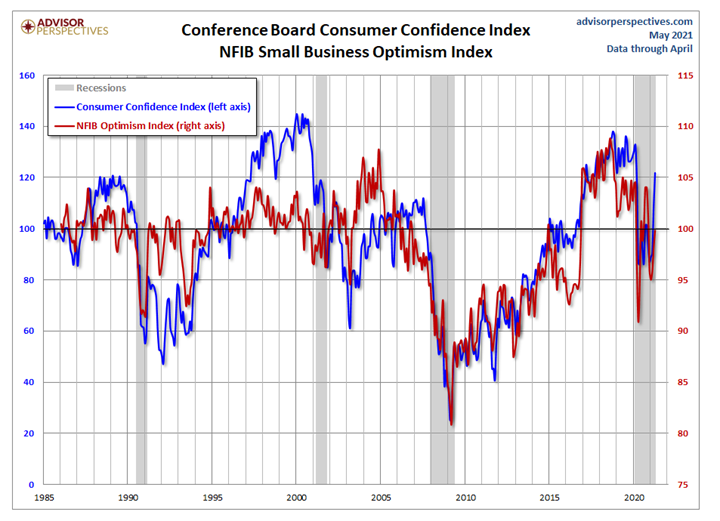
The prevailing mood of the Michigan survey is presented alongside the mood of small business owners, as captured by the NFIB Business Optimism Index (monthly update here). “As the chart illustrates, the two have tracked one another fairly closely since the onset of the Financial Crisis. Although a spread appears infrequently, with the most recent spread showing up 2015 through present,” a spread appears infrequently, with the most recent spread showing up 2015 through present,” said Mislinski.
Consumer Spending
NRF’s calculation of retail sales – which excludes automobile dealers, gasoline stations and restaurants to focus on core retail – showed April was down 1.3% (seasonally adjusted) from March. While retail sales were relatively unchanged compared to previous month, they “grew dramatically year-over-year in April,” as the rapidly recovering U.S. economy climbs out of the pandemic, according to the National Retail Federation (NRF).
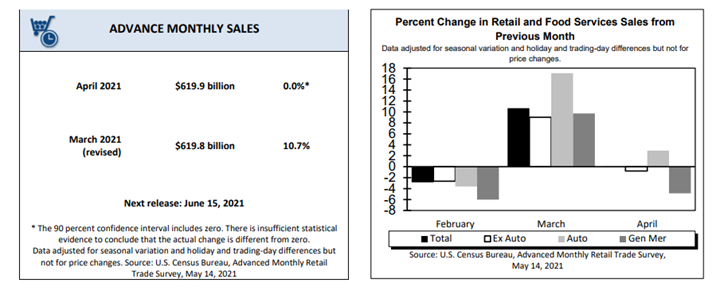
Advance estimates of U.S. retail and food services sales for April 2021 – adjusted for seasonal variation and holiday and trading-day differences, but not for price changes – were $619.9 billion. That is virtually unchanged (± 0.5%)* from the previous month, and 51.2% (± 0.7%) above April 2020. Total sales for the February 2021 through April 2021 period were up 27.1% (± 0.5%) year-over-year. The February 2021 to March 2021 percent change was revised from up 9.7% (± 0.5%) to up 10.7% (± 0.3%). Retail trade sales were down 0.3% (± 0.5%)* from March 2021, but up 46.1% (± 0.7%) compared to last year. Clothing and clothing accessories stores were up 726.8% (± 2.8%) from April 2020, while food services and drinking places were up 116.8% (± 3.0%) from last year.
“Year-over-year growth of 28.8% demonstrates that household finances remain strong, and the economic recovery will likely continue to gain steam as we head into the summer months,” said NRF President and CEO Matthew Shay.
Indeed, the economy and consumer spending have shown great resilience during the past year, said Jack Kleinhenz, chief economist at NRF. “Today’s year-over-year numbers are off the charts in some categories, reflecting the disparity between retailers that could remain open a year ago and those that were forced to shut down. Consumers may have tapped the brakes slightly in April compared with March, but it was like going from 100 mph to 85 mph compared with last year. The fuel from stimulus checks gave a strong boost to spending in March and the fact that April numbers are very close shows spending is clearly going forward and still strong,” he explained.
While higher inflation will diminish real incomes, according to Curtin of Survey of Consumers, the gains in spending will nonetheless be substantial. With consumers in good financial health, a sharp demand is expected to unfold over the coming months.


