KPI – July 2025: The Brief
With optimism staying steady in June, uncertainty began to decline among small business owners...

- KPI – July 2025: State of Business – Automotive Industry
- KPI – July 2025: State of Manufacturing
- KPI – July 2025: State of the Economy
- KPI – July 2025: Consumer Trends
- KPI – July 2025: Recent Vehicle Recalls
The seasonally adjusted Fiserv Small Business Index registered 147.8 in June, a 1.4% dip month-over-month but a 4.4% increase year-over-year. In addition, the Fiserv Small Business Transaction Index was 112.3, with transactions growing 2.2% year-over-year.
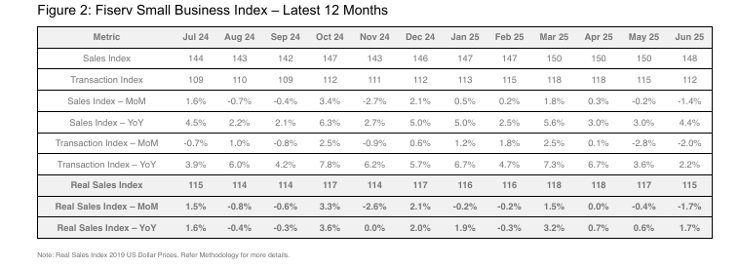
Key Takeaways, Courtesy of The Fiserv Small Business Sales Index:
- Overall, the year-over-year trend is resilience, but prices are creeping upward – and quickly. Small business sales accelerated 4.4% year-over-year, lifted by increased transactions (+2.2%) and average ticket growth (2.1%).
- Consumers continue to tighten their discretionary spending. In June, discretionary spending fell 2.5% month-over-month, with foot traffic at a similar pace. While discretionary sales grew 1.3% year-over-year, consumers are “bargain hunting” over the long term, with average tickets down 0.4% year-over-year.
- These days, spending on necessities comes at a higher cost for consumers. Although sales and foot traffic associated with essential goods and services were up 7.5% and 3.5%, respectively, they are more expensive. In fact, average tickets on essentials increased year-over-year during the last 7 months, “putting a squeeze on consumers’ personal budgets.”
- Data shows restaurants continue to face strong headwinds. Foot traffic erosion stifled month-over-month sales growth, posting four consecutive months of decline. Annualized growth shows a similar slowing pattern. According to report details, consumers have aggressively tried to stretch their dollars by leaning into QSR more options.
- The Fiserv Small Business Index for professional, scientific and technical services in the U.S. increased by 9% year-over-year, while the Real Fiserv Small Business Index rose by 6.2% year-over-year, indicating long-term change. Meanwhile, the Fiserv Small Business Index for ambulatory health care services decreased by 3.3% month-over-month, and the Real Fiserv Small Business Index declined by 3.4%, showing a short-term trend. The Fiserv Small Business Transaction Index for specialty trade contractors in the U.S. rose by 4.4%, reflecting growth in customer visits.
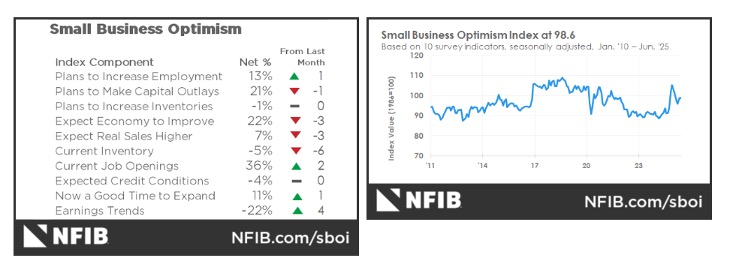
In June, the NFIB Small Business Optimism Index held steady – edging down 0.2 of a point to 98.6, slightly above the 51-year average of 98. According to survey data, a substantial number of respondents reported excess inventories, which significantly contributed to the overall decline in the index. In addition, the Uncertainty Index decreased by five points from May to 89. Of all the challenges, 19% of small business owners reported taxes as their single most important problem – up one point from May and the top issue for a second month.
“Small business optimism remained steady in June, while uncertainty fell. Taxes remain the top issue on Main Street, but many others are still concerned about labor quality and high labor costs,” says Bill Dunkelberg, NFIB chief economist.
Important Takeaways, Courtesy of NFIB:
- A net negative 5% (seasonally adjusted) of owners viewed current inventory stocks as “too low,” down six points from May. This signals a net increase in inventories, with 7% reporting inventories “too low” in June compared to 8% in May. Another 12% reported current inventories “too high” in June compared to 7% in May. This component contributed the most to the Optimism Index’s decline.
- The net percent of owners expecting better business conditions fell three points to a net 22% (seasonally adjusted). Historically, this is still a positive reading with the 51-year average at a net 3%.
- The net percent of owners expecting higher real sales volumes fell three points to a net 7% (seasonally adjusted).
- Twenty-one percent (seasonally adjusted) plan capital outlays in the next six months, down one point.
- The percent of small business owners reporting labor quality as the single most important problem for business remained at 16%. The last time complaints about labor quality fell below 16% was in April 2020. Fewer small business owners are reporting labor as their top problem, which aligns with other data suggesting a more tempered labor market economy-wide.
- Another 11% of owners reported inflation as their single most important problem in operating their business (higher input costs), down three points from May and the lowest reading since September 2021. Inflation pressures continue to ease on Main Street.
- The data on overall health of respondents’ businesses showed substantial deterioration, with declines in the percentages reporting their business was in excellent or good health. When asked to rate the overall health of their business, 8% reported excellent (down six points) and 49% reported good (down six points). Thirty-five percent reported the health of their business was fair (up seven points), and 7% reported poor (up three points).
Professionals in the automotive, RV and powersports industries remain steadfast in their efforts to evolve their business models and grow their brands in the face of adversity. As such, the monthly Key Performance Indicator Report serves as an objective wellness check on the overall health of our nation, from the state of manufacturing and vehicle sales to current economic conditions and consumer trends. Below are a few key data points explained in further detail throughout the report.
Key Data Points:
- Economic activity in the manufacturing sector contracted for the fourth consecutive month, following a two-month expansion preceded by 26 straight months of contraction, according to the nation’s supply executives in the latest Manufacturing ISM Report On Business. The Manufacturing PMI registered 49% in June, a 0.5% increase compared to the 48.5% recorded in May.
- In July, the Consumer Price Index for All Urban Consumers (CPI-U) increased 0.3% on a seasonally-adjusted basis, after rising 0.1% in May, according to the U.S. Bureau of Labor Statistics. Over the last 12 months, the all-items index increased 2.7% before seasonal adjustment.
- In June, the Global Light Vehicle (LV) selling rate improved to 93 million units per year. In addition, the market grew over 2% year-over-year, as sales reached 7.7 million units globally. Total new-vehicle sales for July 2025, including retail and non-retail transactions, are projected to reach 1,380,500—a 3.2% year-over-year increase, according to a joint forecast from J.D. Power and GlobalData.
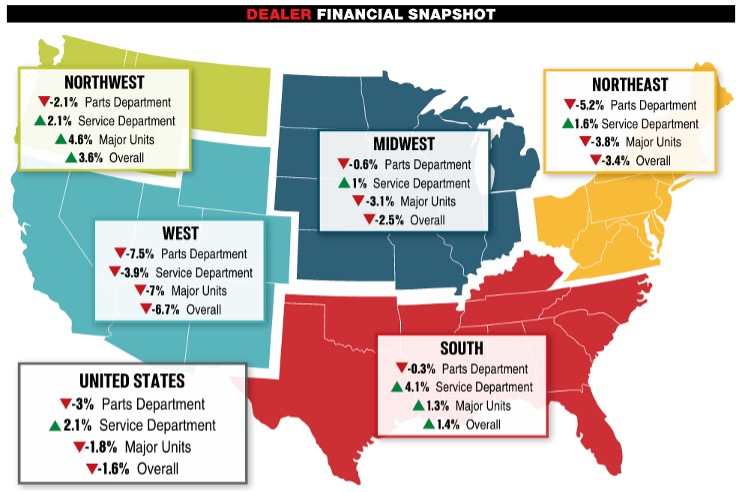
- Powersports Business says dealers across the country reported an overall combined revenue decline of 1.6% year-over-year in May, according to composite data from more than 1,700 dealerships in the U.S. that utilize CDK Lightspeed DMS. On average, dealerships were down 1.8% in major units and 3% in parts, but up 2.1% in service.