KPI – July 2025: State of the Economy
Even as consumer & business confidence remain tempered, the U.S. labor market showed stability in June…

- KPI – July 2025: The Brief
- KPI – July 2025: State of Manufacturing
- KPI – July 2025: State of Business – Automotive Industry
- KPI – July 2025: Consumer Trends
- KPI – July 2025: Recent Vehicle Recalls
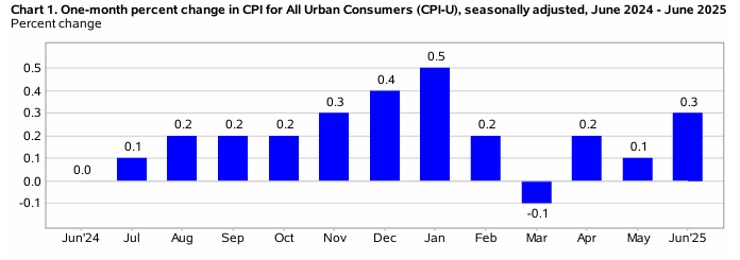
In June, the Consumer Price Index for All Urban Consumers (CPI-U) increased 0.3% on a seasonally-adjusted basis, after rising 0.1% in May, according to the U.S. Bureau of Labor Statistics. Over the last 12 months, the all-items index increased 2.7% before seasonal adjustment.
Important Takeaways, Courtesy of the U.S. Bureau of Labor Statistics:
- The index for shelter rose 0.2% and served as the primary factor in the all-items monthly increase. The energy index rose 0.9%, as the gasoline index increased 1% month-over-month. In addition, the index for food increased 0.3%, with the index for food-at-home rising 0.3% and the index for food-away-from-home up 0.4%. Overall, the food index increased 3% year-over-year.
- Indexes on the rise include household furnishings and operations, medical care, recreation, as well as apparel and personal care. The indexes for used cars and trucks, new vehicles and airline fares were among the major indexes to decrease in June.
Overall, the all-items index rose 2.7% year-over-year, after rising 2.4% last month. The all items less food and energy index rose 2.9%, while the energy index decreased 0.8%.
Employment
Total nonfarm payroll employment increased by 147,000 in June – above economic estimates of 110,000. April and May data were upwardly revised to 158,000 and 144,000, respectively. Employment continued to climb in state and local government, as well as health care, while federal government shed jobs.
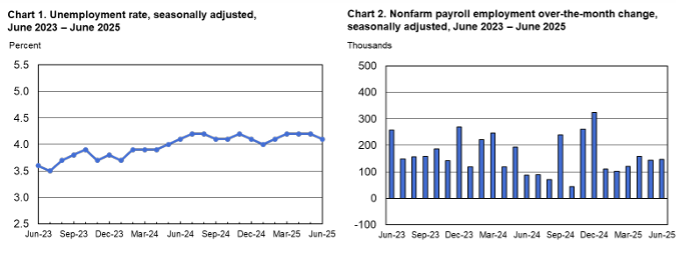
According to the U.S. Bureau of Labor Statistics, the unemployment rate and number of unemployed persons declined to 4.1% and 7 million, respectively – the former of which is the lowest reading since February. In addition, the labor force participation and long-term unemployed (those jobless for 27 weeks or more) rates registered 62.3% (its lowest level since late 2022) and 23.3%, respectively.
“A more encompassing rate that includes discouraged workers and those holding part-time positions for economic reasons edged down to 7.7%, the lowest since January,” reports CNBC correspondent Jeff Cox.
Along with the solid payroll gains and fall in the unemployment rate, average hourly earnings increased 0.2% for the month and 3.7% from a year ago, indicating little upward pressure on wage-related inflation. The average work ticked down to 34.2 hours.
“The solid June jobs report confirms that the labor market remains resolute and slams the door shut on a July rate cut,” says Jeff Schulze, head of economic and market strategy at ClearBridge Investments. “Today’s good news should be treated as such by the markets, with equities rising despite the accompanying pickup in interest rates.”
By Demographic
This month, unemployment rates among the major worker groups: adult women – 3.6%; adult men – 3.9%; teenagers – 14.4%; Asians – 3.5%; Whites – 3.6%; Hispanics – 4.8%; and Blacks – 6.8%.
Last month, unemployment rates among the major worker groups: adult women – 3.9%; adult men – 3.9%; teenagers – 13.4%; Asians – 3.6%; Whites – 3.8%; Hispanics – 5.1%; and Blacks – 6%.
![]()

By Industry
The Conference Board Employment Trends Index (ETI) held steady at 107.83 in June. Data shows the flat reading in the ETI was a result of slight negative contributions from five of its eight components: Job Openings, Real Manufacturing and Trade Sales, Industrial Production, Initial Claims for Unemployment Insurance, and Number of Employees Hired by the Temporary-Help Industry. Whereas the following three components contributed positively: Percentage of Firms with Positions Not Able to Fill Right Now, Ratio of Involuntarily Part-time to All Part-time Workers, Percentage of Respondents Who Say They Find Jobs Hard to Get.
“The June ETI underscored that the U.S. labor market remains stable,” says Mitchell Barnes, economist at The Conference Board. “Though ongoing uncertainty continues to temper consumer and business confidence.”
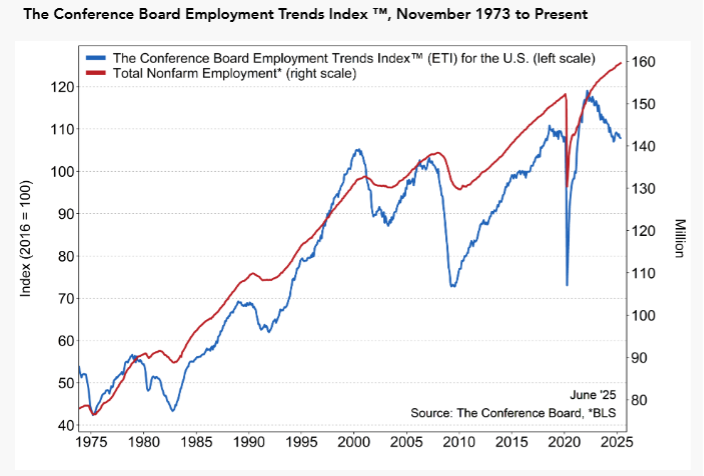
Caption: The Employment Trends Index is a leading composite index for payroll employment. When the Index increases, employment is likely to grow as well, and vice versa. Turning points in the Index indicate that a change in the trend of job gains or losses is about to occur in the coming months.
According to the ETI, the share of consumers who report “jobs are hard to get” – a component from the Consumer Confidence Survey – declined from 18.4% in May to 18.1% in June. The share of small firms that report jobs are “not able to be filled right now” rose from 34% in May to 36% in June; however, it remains below the 2024 average of 37.5%. JOLTS job openings in May also showed an increase, rising to 7.8 million from 7.4 million in April, to reach the highest level since November.
“While uncertainty may be weighing on business and consumer confidence, May employment data indicated that hiring continued to keep the labor market roughly in balance,” Barnes says. “However, we are beginning to see some sector erosion that could suggest emerging pressures from tariff shifts.”
Important Takeaways, Courtesy of The Conference Board Employment Trends Index:
- Initial claims for unemployment insurance increased modestly in June. Meanwhile, continuing unemployment claims are on the rise, but the pace has not accelerated.
- The share of involuntary part-time workers also declined from 17% in May to 16.5% in June.
- Employment in the temporary-help industry fell by 2,600 in June – and have now declined five out of six months in 2025.
- Industrial production and real manufacturing and trade sales each moderated slightly in recent data, likely impacted by ongoing tariff and trade volatility.
“New data ultimately still show a continuation of the recent low-hiring, low-firing environment,” Barnes says, “but the question is to what extent the build-up of uncertainty will translate into a broader softening in activity and labor demand.”
Important Takeaways, Courtesy of the U.S. Bureau of Labor Statistics:
- Health care added 39,000 jobs in June, in line with its monthly gain of 43,000 over the prior 12 months. Job gains occurred in hospitals (+16,000) and in nursing and residential care facilities (+14,000).
- Social assistance employment continued to trend up (+19,000), reflecting continued growth in individual and family services (+16,000).
- Government employment rose by 73,000. Employment in state government increased by 47,000, largely in education (+40,000). Employment in local government education continued to trend up (+23,000).
- Job losses continued in federal government (-7,000), where employment is down by 69,000 since reaching a recent peak in January.
Click here to review more employment details.


