KPI – July 2025: State of Business – Automotive Industry
Incentive spending is down in July, reflecting the cost pressure that manufacturers are under due to tariffs…

- KPI – July 2025: The Brief
- KPI – July 2025: State of Manufacturing
- KPI – July 2025: State of the Economy
- KPI – July 2025: Consumer Trends
- KPI – July 2025: Recent Vehicle Recalls
Global Light Vehicle Sales
In June, the Global Light Vehicle (LV) selling rate improved to 93 million units per year. In addition, the market grew over 2% year-over-year, as sales reached 7.7 million units globally.
Trade tensions are creating waves in key markets like the U.S. and Western Europe. In June, stateside sales were down due to two fewer selling days and previous-year events impacting this year’s sales data. Across Western Europe, consumer confidence remains weak in the face of stagnant economic growth and political uncertainty. According to GlobalData, China, Japan, Korea and South America posted the most significant contributions to year-over-year sales increases. In China, consumers are more confident that economic uncertainty is easing. In addition, aggressive pricing strategies by Chinese manufacturers are stimulating demand – even as the trade war creates the potential for lower sales of Chinese brands in some overseas markets.
In July, the global selling rate is projected to reach 91.3 million units, a 2.1% year-over-year increase. China and Japan are likely to lead the pack in largest year-over-year sales increases.
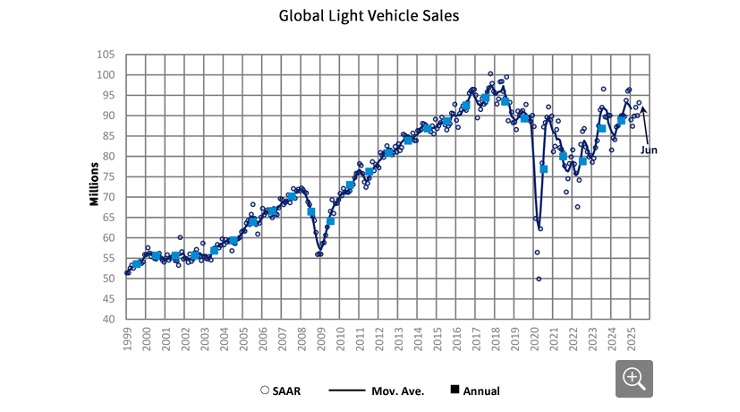
“Consumer spending is rising in China, and the automotive sector is seeing further incentives and free upgrades to provide more value to buyers without increasing pricing,” says David Oakley, manager of Americas vehicle sales forecasts at GlobalData.
“[Looking ahead,] the trade war shows no signs of reaching a conclusion, with the Trump administration threatening further tariffs on various countries in recent weeks,” he continues. “Still, resilience in China and some emerging markets should allow for total 2025 global sales to grow 1.4% year-over-year (or 90 million units).”
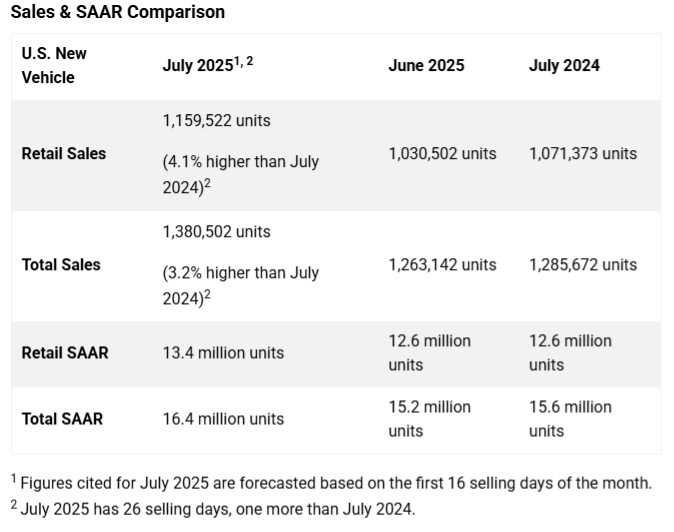
U.S. New Vehicle Market
Total new-vehicle sales for July 2025, including retail and non-retail transactions, are projected to reach 1,380,500—a 3.2% year-over-year increase, according to a joint forecast from J.D. Power and GlobalData.
“July retail sales are projected to finish 4.1% higher than a year ago, but interpreting that gain requires care due to events both last year and this year, which disrupted normal monthly sales patterns,” says Thomas King, president of the data and analytics division at J.D. Power.
Specifically, King notes two timing-related factors. First, last year’s dealer software outage pushed 85,000 sales into July and August 2024, making year-over-year comparisons appear weaker than actual performance. Second, the tariff-related pull-ahead of 173,000 sales during spring 2025 is starting to have an impact – “deflating” July 2025 results.
“In addition, July results are also being impacted by lower-than-normal incentive escalation by manufacturers,” he says. “Instead of discounts rising as they normally would at this time of year, incentive spending has edged down to 6.1% of MSRP in July from 6.3% in January, reflecting the cost pressure that manufacturers are under due to tariffs.”
In anticipation of federal credits expiring on electric vehicle purchases at the end of September, many “EV intenders” are also accelerating purchases that would have occurred either later this year or early next year.
Key Takeaways, Courtesy of J.D. Power:
- Retail buyers are on pace to spend $49.8 billion on new vehicles, up $5 billion year-over-year.
- Internal combustion engine (ICE) vehicles are projected to account for 74% of new-vehicle retail sales, a decrease of 3.7 percentage points from a year ago. Plug-in hybrid vehicles (PHEV) are on pace to make up 2.2% of sales, up 0.2 percentage points. Electric vehicles (EV) and hybrid electric vehicles (HEV) are projected to account for 10.9% and 13.9% of new vehicle retail sales – up 1.6 and 2.9 percentage points, respectively.
- Trucks/SUVs are on pace to account for 82.3% of new vehicle retail sales, up 2.3 percentage points year-over-year.
- Leasing is expected to account for 22% of sales this month, down 2.1 percentage points from a year ago.
- Fleet sales are estimated to total 220,980 units, down 0.8% year-over-year. Fleet volume is expected to account for 16% of total light-vehicle sales, down four percentage points from a year ago.
- Average incentive spending per unit in July should hit $3,051, up $52 from a year ago.
- Average monthly finance payments are on pace to be $742, up $12 year-over-year. The average interest rate for new-vehicle loans is expected to be 6.54%, down 0.30 percentage points from a year ago.
- Average monthly finance payments are on pace to be $748, up $22 from last year. The average interest rate for new-vehicle loans is expected to be 6.89%, down 0.08 percentage points year-over-year.
- Total retailer profit per unit, which includes vehicle gross plus finance and insurance income, is expected to be $2,257 – up $23 year-over-year, but down $52 from June. Total aggregate retailer profit from new-vehicle sales for this month is projected to be $2.5 billion, up 10.1% year-over-year.
“August results will again require cautious interpretation. The 2024 dealer software outages that suppressed June sales inflated volumes in July and August, will again distort year-over-year comparisons. At the same time, the payback from this year’s tariff-driven pull-ahead in March and April will continue to weigh on August sales, although at a much more diminished level. Pricing and incentive decisions formed by tariff expectations will also affect the sales pace. On average, tariffs are adding $4,275 per vehicle, though the effects on individual models vary widely,” King says.
“Despite this, most price increases have remained modest, with some models seeing little to no change. Additional price adjustments are expected through the fall season, especially as new model-year vehicles launch, but final pricing strategies may not emerge until after year-end sales events,” he continues.
U.S. Used Market
Wholesale used-vehicle prices (on a mix-, mileage- and seasonally-adjusted basis) decreased 0.7% from June during the first 15 days of July. The mid-month Manheim Used Vehicle Value Index registered 206.9, rising 2.6% from the full month of July 2024. The seasonal adjustment reduced the results for the index in the month, which was lower than normal.
“Price appreciation trends against last year are starting to moderate as we enter Q3, a time that showed stronger pricing than normal for wholesale markets last year,” says Jeremy Robb, senior director of economic and industry insights at Cox Automotive. “In the first two weeks of July, depreciation trends are slightly elevated for the MUVVI index, though used retail sales and supply are holding steady. Last year saw stronger appreciation rates than normal throughout most of Q3, so the index gains over 2024 levels should start to moderate, as we expected. However, wholesale supply is quite a bit tighter than last year, so supply and demand are well balanced currently.”
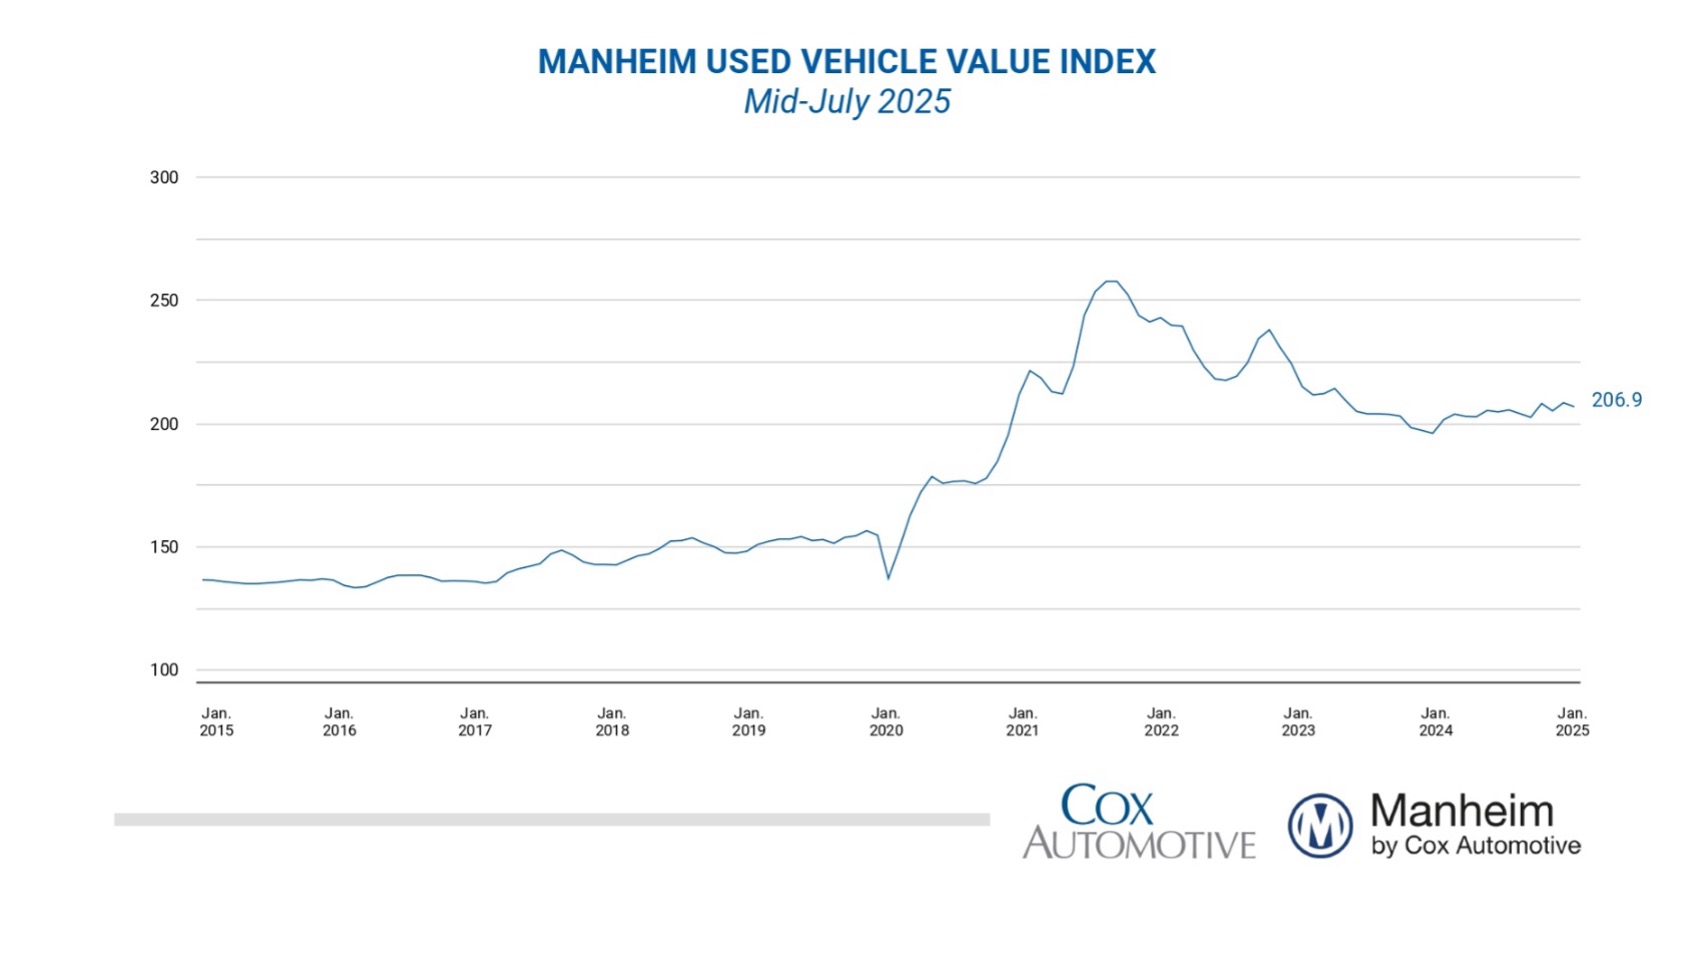
According to Manheim, most major market segments experienced positive year-over-year results for seasonally-adjusted prices during the first half of July. Compared to the industry’s year-over-year increase of 2.6%, the luxury segment performed the best, rising by 5.6% and outperforming the market. SUVs and trucks were up 2.1% and 0.8%, while mid-size and compact cars decreased 1.2% and 4%, respectively. Electric vehicles (EVs) posted the strongest year-over-year gains at 6.8%, while the non-EV segment increased by 2.3%.
Most segments dipped in month-over-month stats. The overall industry declined by 0.7% compared to the prior month. Midsize and compact cars decreased 0.5% and 0.2%, respectively. Luxury and SUVs were down 1.4% and 1.1%, but trucks posted a small gain of .5%. EVs had the largest declines, dropping 2.1% in the first half of July, while non-EVs were unchanged against June in the first half of the month.
According to JD Power, 25.5% of trade-ins are expected to carry negative equity this month – a year-over-year increase of 1.9%.


