KPI — July 2023: State of Business

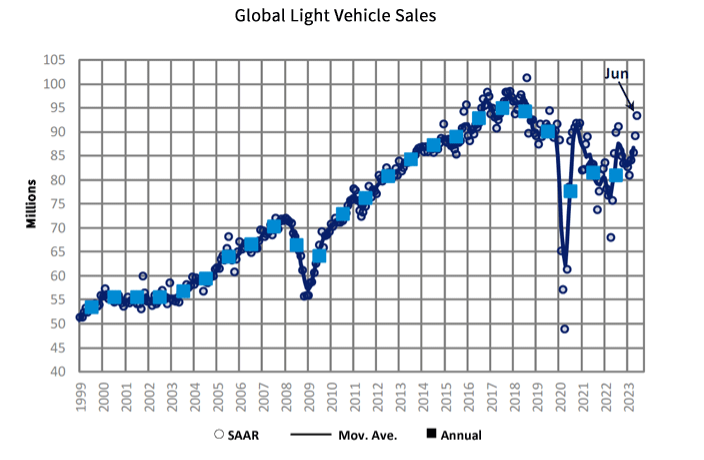
GlobalData reports the global light vehicle (LV) selling rate increased steadily from 89 million units/year in May to 93 million units/year in June. All major markets outperformed year-over-year data, with global LV sales registering 7.9 million units (+10% YoY) last month.
US light vehicle sales registered 1.4 million units (+20% YoY), as OEMs enjoyed improved vehicle production levels due to easing supply chain constraints. China posted its strongest month of the year thus far, with a selling rate of 33 million units/year. In addition, all major West European countries recorded positive YoY growth as their markets continue to recover from headwinds in 2022.
“May outperformed expectations, resulting in a slight increase to the overall outlook for global light-vehicle sales in 2023. The current forecast is up 200,000 units from last month to 86.3 million units, an increase of 7%. Unfulfilled global demand is estimated at 3.5-4 million units, so the market is still not at equilibrium,” says Jeff Schuster, group head and executive vice president, automotive at GlobalData.
“We remain cautiously optimistic about the remainder of 2023, given the current positive momentum. However, risk remains elevated and even as supply disruption eases, other risks emerge such as rail car shortages in the United States. The outlook for 2024 global light-vehicle sales remains stable at 90.3 million units, an increase of nearly 5% from 2023,” he continues.
State of Manufacturing
The June Manufacturing PMI® registered 46%, 0.9 percentage point lower than the 46.9% recorded in May, according to the nation’s supply executives in the latest Manufacturing ISM® Report On Business®.
“The U.S. manufacturing sector shrank again, with the Manufacturing PMI® losing ground compared to the previous month, indicating a faster rate of contraction. The June composite index reading reflects companies continuing to manage outputs down, as softness continues and optimism about the second half of 2023 weakens,” says Timothy R. Fiore, CPSM, C.P.M., chair of the Institute for Supply Management® (ISM®) Manufacturing Business Survey Committee.
Important takeaways, Courtesy of the Manufacturing ISM® Report On Business®:
- Demand eased again, with the (1) New Orders Index contracting but at a slower rate, (2) New Export Orders Index moving into contraction and (3) Backlog of Orders Index remaining at a level not seen since early in the coronavirus pandemic (May 2020).
- The Customers’ Inventories Index dropped into ‘too low’ territory, a positive for future production.
- Output/Consumption (measured by the Production and Employment indexes) was negative, with a combined 7.7-percentage point downward impact on the Manufacturing PMI® calculation. Panelists’ companies reduced production and began using layoffs to manage head counts (to a greater extent than in prior months), amid mixed sentiment about when significant growth will return.
- Inputs – defined as supplier deliveries, inventories, prices and imports – continue to accommodate future demand growth.
- The Supplier Deliveries Index continued to indicate faster deliveries, and the Inventories Index dropped further into contraction as panelists’ companies try to mitigate inventories exposure.
- The Prices Index fell further into ‘decreasing’ territory. Manufacturing lead times improved again but remain at elevated levels.
U.S. New Vehicle Sales
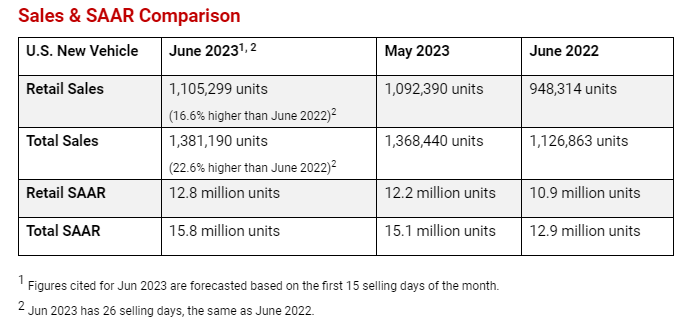
Total new-vehicle sales, including retail and non-retail transactions, are projected to reach 1,381,200 units – a 22.6% year-over-year increase, according to a joint forecast from J.D. Power and GlobalData.
“The 2023 theme of strong sales growth, enabled by increased vehicle production and pent-up demand, is continuing in June,” said Thomas King, president of the data and analytics division at J.D. Power. “On a volume basis, June year-to-date total sales will be just more than 7.6 million units, an increase of 13.6% but still below pre-pandemic sales levels which were north of 8 million. Volume growth is being complemented by further increases in transaction prices, which are trending towards being up 3% for the first half of 2023 despite increases in OEM incentives and declines in dealer grosses,” he continues.
“As a result, it’s anticipated that consumers will spend nearly $281.4 billion on the purchase of new vehicles in the first half of 2023, a noteworthy 8% growth from the same period a year ago.”
Important Takeaways, Courtesy of J.D. Power:
- Retail buyers are on pace to spend $47.9 billion on new vehicles, up $6 billion year-over-year.
- Truck/SUVs are estimated to account for 77.7% of new vehicle retail sales in June.
- The average new-vehicle retail transaction price in June is expected to reach $45,978.
- Average interest rates for new-vehicle loans are expected to increase to 7%, 194 basis points higher than a year ago.
- Fleet sales are on pace to total 275,900 units in June, up 54.5% year-over-year on a selling day adjusted basis. Fleet volume is expected to account for 20% of total light vehicle sales, up from 16% a year ago.
- The total retailer profit per unit, which includes grosses, finance and insurance income, is expected to reach $3,692 in June.
“In the coming months, the industry may face challenges, such as higher interest rates and changing economic conditions. Despite the potential effect of these economic risks, the industry will continue to benefit from pent-up demand for new vehicles. As new-vehicle availability gradually improves, there will be an easing of the current record levels of pricing and profitability as manufacturer incentives gradually increase and retailer profit margins gradually fall. Nevertheless, this will be offset to some extent by an increase in overall sales volumes,” King says.
U.S. Used Market
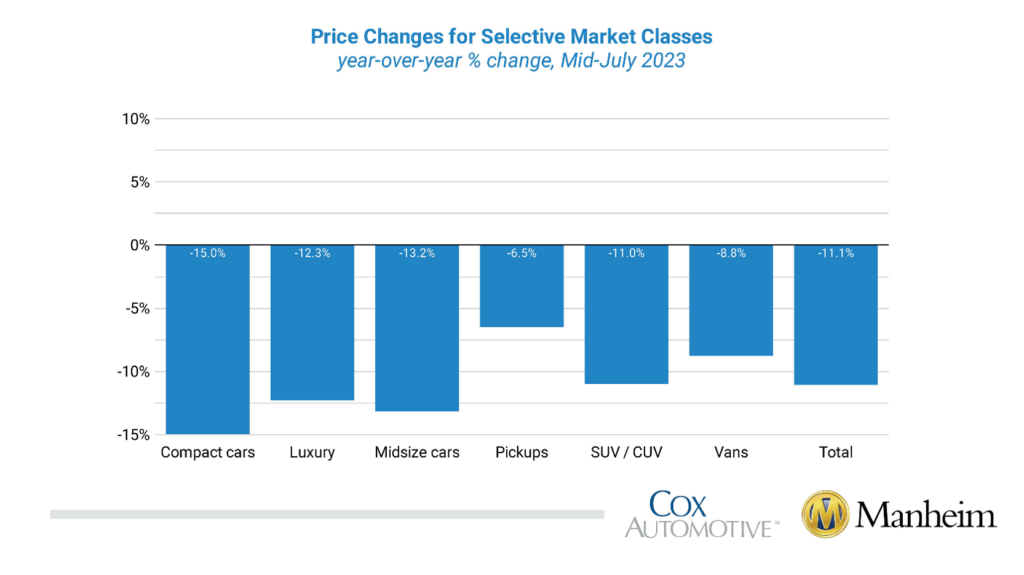
Wholesale used-vehicle prices (on a mix-, mileage- and seasonally-adjusted basis) decreased 1% in the first 15 days of July. The mid-month Manheim Used Vehicle Value Index dipped to 213.1, down 11.1% year-over-year. The seasonal adjustment mitigated the decline.
According to Manheim, all major market segments posted seasonally-adjusted prices that were lower year-over-year in the first half of July. Pickups declined the least (down 6.5%), followed by vans (down 8.8%). Compact cars decreased the most at 15%, followed by midsize cars (13.2%). All major segments also saw price decreases compared to June, with losses ranging from 0.5% to 2.1%. Again, sports cars were the sole outlier versus the other segments, with a 2.6% month-over-month gain.
Used-vehicle prices declined slightly from a year ago but remain close to all-time highs. Currently, JD Power says the average trade-in equity is approximately $9,979, down $78. For context, trade equity this month is still more than double the pre-pandemic level, helping owners offset some of the pricing and interest rate increases.
KPI — July 2023: Recent Vehicle Recalls
Key Performance Indicators Report — July 2023


