KPI — July 2023: Consumer Trends

The Conference Board Consumer Confidence Index® increased to 109.7 (1985=100) in June, up from 102.5 a month ago. The Present Situation Index – based on consumers’ assessment of current business and labor market conditions – rose to 155.3 (1985=100) from 148.9. The Expectations Index – based on consumers’ short-term outlook for income, business and labor market conditions – increased to 79.3 (1985=100) from 71.5. Despite improvement, expectations remain below 80 – a level historically associated with recessionary fears.
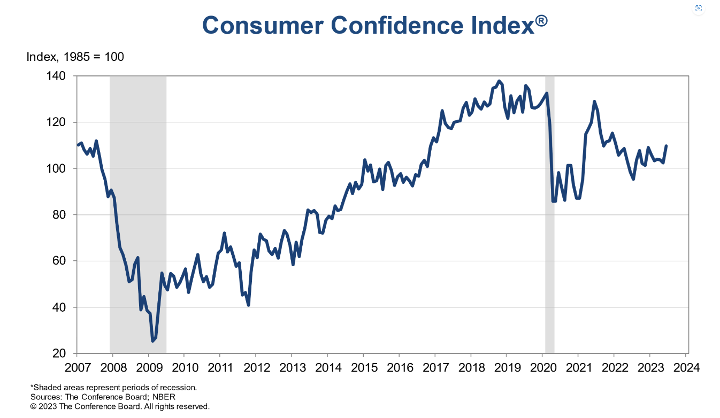
According to recent data, “greater confidence” was most prominent among consumers under age 35 and those with earning incomes over $35,000. While consumers expressed a more upbeat outlook this month, the expectations gauge shows consumers anticipate a recession at some point during the next 6 to 12 months.
As such, The Conference Board Consumer Confidence Index® indicates consumers may be showing signs of “pulling back spending” in the face of stubbornly high prices and interest rates. Recent data shows caution in purchasing vehicles, homes and even vacations.
“This is an important indicator of desires to spend on services ahead, which may be a signal that post-pandemic ‘revenge spending’ on travel may have peaked and is likely to slow over the rest of this year,” says Dana Peterson, chief economist at The Conference Board.
The chart evaluates the historical context for this index as a coincident indicator of the economy. Toward this end, Advisor Perspectives highlighted recessions and included GDP. To put today’s report into the larger historical context since its beginning in 1978, consumer sentiment is 14.7% below its average reading (arithmetic mean) and 13.6% below its geometric mean. The current index level is at the 21st percentile of the 547 monthly data points in this series. This indicator is somewhat volatile, with a 3.1- point absolute average monthly change. The latest data point, for example, posted an 8.2-point increase month-over-month.
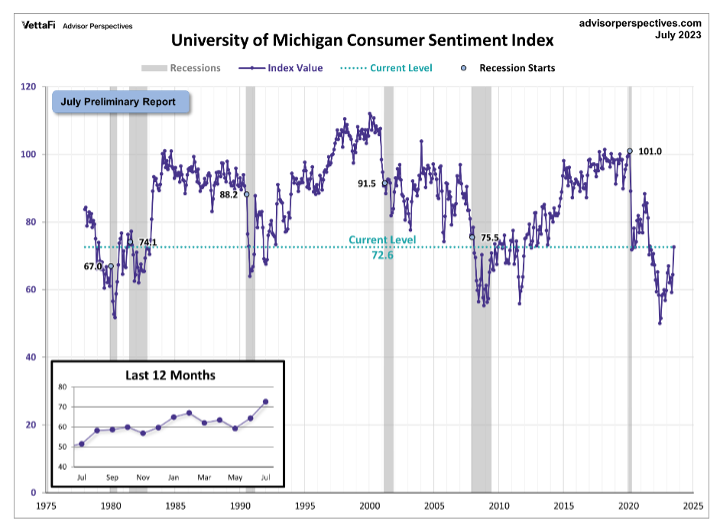
Similarly, the University of Michigan Survey of Consumers – a survey consisting of approximately 50 core questions covering consumers’ assessments of their personal financial situation, buying attitudes and overall economic conditions – registered 64.4 in June, up from 59.2 a month prior.
“The recent fall in gas prices and rise in stock prices are boosting consumers’ confidence,” explains Kieran Clancy, senior US economist at Pantheon Macroeconomics.
Important Takeaways, Courtesy of Survey of Consumers:
- Consumer sentiment increased for the second straight month, soaring 13% above June and reaching its most favorable reading since September 2021.
- All components of the index improved considerably, led by a 19% surge in long-term business conditions and 16% increase in short-run business conditions.
- Overall, sentiment rose across all demographic groups except for lower-income consumers.
- Year-ahead inflation expectations were little changed, inching up from 3.3% in June to 3.4% in July. Long-run inflation expectations also were relatively unchanged from June at 3.1%, remaining within the narrow 2.9-3.1% range for 23 of the last 24 months.
Consumer Income & Spending
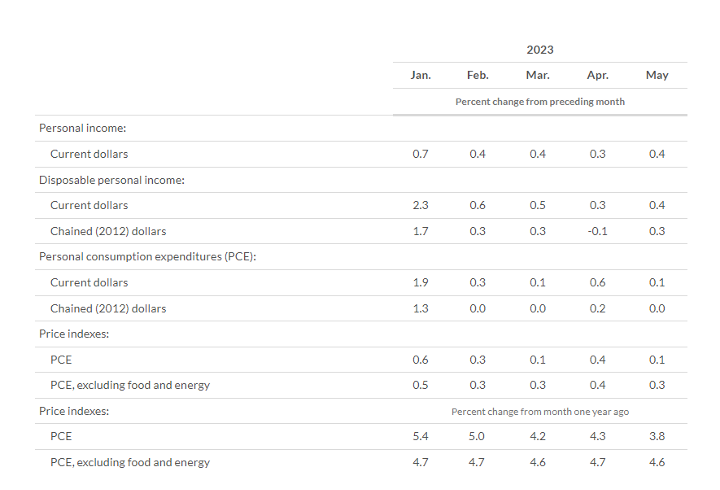
According to the U.S. Bureau of Economic Analysis (BEA), in May 2023 personal income increased $91.2 billion (.4%), disposable personal income (DPI) increased $86.7 billion (0.4%) and personal consumption expenditures (PCE) increased $18.9 billion (0.1%).
In addition, personal outlays – the sum of PCE, personal interest payments and personal current transfer payments – increased $22.7 billion. Personal saving was $910.3 billion in May and the personal saving rate –personal saving as a percentage of disposable personal income – was 4.6%.
Important Takeaways, Courtesy of BEA:
- In May, the $18.9 billion increase in current-dollar PCE reflected an increase of $52 billion in spending for services that was partly offset by a $33.1 billion decrease in spending for goods. Within services, the leading contributors to the increase were health care (led by outpatient services), “other” services (led by international travel) and transportation services (led by air transportation). Spending on motor vehicles and parts (led by new light trucks), plus gasoline and other energy goods, were the largest contributors to the decrease within goods.
- The PCE price index increased 3.8% year-over-year. Prices for goods and services increased 1.1% and 5.3%, respectively. While food prices increased 5.8%, energy prices decreased 13.4%. Excluding food and energy, the PCE price index increased 4.6% year-over-year.
Key Performance Indicators Report — July 2023


