KPI — July 2022: Consumer Trends
The Conference Board Consumer Confidence Index® fell to 98.7 (1985=100), down 4.5 points from 103.2 in May and now at its lowest level since February 2021 (Index, 95.2). The Present Situation Index – which is based on consumers’ assessment of current business and labor market conditions – declined marginally to 147.1 from 147.4 last month. The Expectations Index – derived from consumers’ short-term outlook for income, business and labor market conditions – decreased sharply to 66.4 from 73.7.
“While the Present Situation Index was relatively unchanged, the Expectations Index continued its recent downward trajectory – falling to its lowest point in nearly a decade,” says Lynn Franco, senior director of economic indicators at The Conference Board. “Consumers’ grimmer outlook was driven by increasing concerns about inflation, in particular rising gas and food prices. Expectations have now fallen well below a reading of 80, suggesting weaker growth in the second half of 2022, as well as growing risk of recession by year-end.”
Franco says purchasing intentions for cars, homes and major appliances held relatively steady, though intentions cooled since the start of the year. The trend is likely to continue as the Fed aggressively raises interest rates to try and tame inflation. Over the next six months, Franco expects consumer spending and economic growth to continue facing strong headwinds from further inflation and rate hikes.
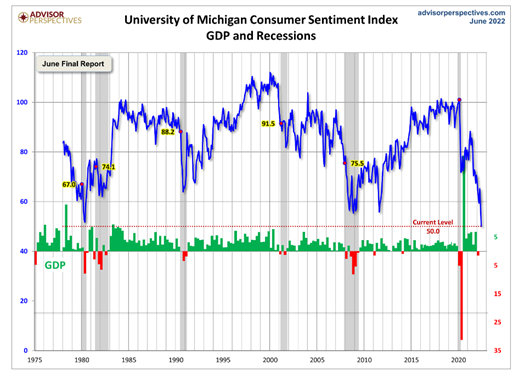
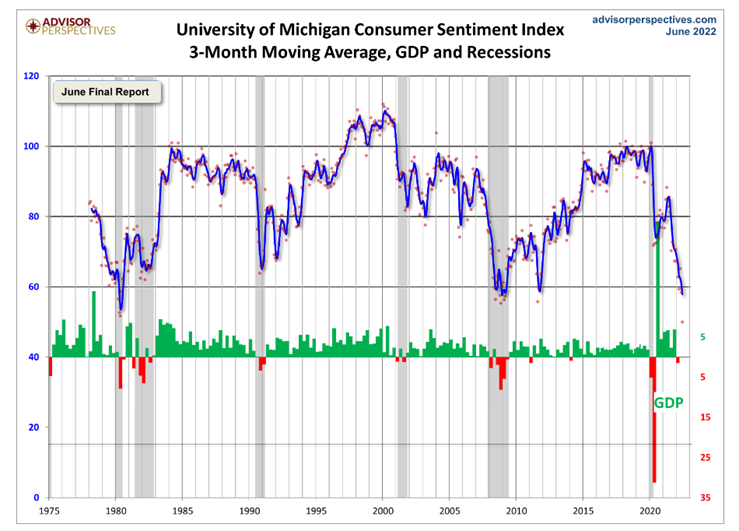
The chart evaluates the historical context for this index as a coincident indicator of the economy. Toward this end, Advisor Perspectives highlighted recessions and included GDP. To put the current report into larger historical context since its beginning in 1978, consumer sentiment is 41.7% below the average reading (arithmetic mean) and 41% below the geometric mean. The current index level is at the null percentile of the 534 monthly data points in this series. Note this indicator is somewhat volatile, with a three point absolute average monthly change. The latest data point saw a 8.4-point decrease month-over-month.
Similarly, The Consumer Sentiment Index – a survey consisting of approximately 50 core questions covering consumers’ assessments of their personal financial situation, buying attitudes and overall economic conditions –declined significantly to 50 in June, according to the University of Michigan Survey of Consumers. It is the lowest reading on record, inclusive of consumers across income, age, education, geographic region, political affiliation, stockholding and homeownership status.
- Approximately 79% of consumers expect “bad times” in the year ahead for business conditions, the highest since 2009.
- Nearly 47% of consumers blamed inflation for eroding their living standards, just one point shy of the all-time high last reached during the Great Recession.
- The final June reading of the median expected year-ahead inflation rate was 5.3%, little changed from mid-month or the preceding four months. In contrast, long-run expectations receded from its mid-month reading of 3.3% and settled at 3.1%, back within the 2.9 – 3.1% range seen during the past 10 months. Consumers also expressed the highest level of uncertainty over long-run inflation since 1991, continuing a sharp increase that began in 2021.
Consumer Income & Spending
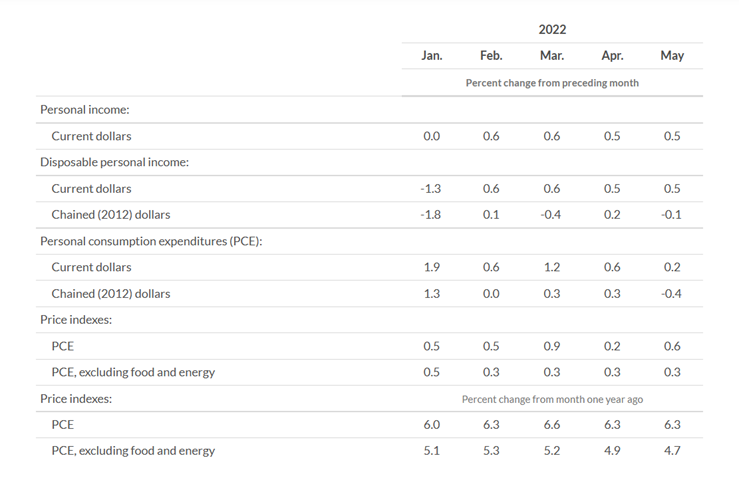
According to the U.S. Bureau of Economic Analysis (BEA), personal income increased $113.4 billion (.5%) in May, while disposable personal income (DPI) increased $96.5 billion (.5%) and personal consumption expenditures (PCE) increased $32.7 billion (.2%).
Important Takeaways, Courtesy of BEA:
- The $32.7 billion increase in current-dollar PCE reflected an increase of $76.2 billion in spending for services that were partly offset by a decrease of $43.5 billion in spending for goods.
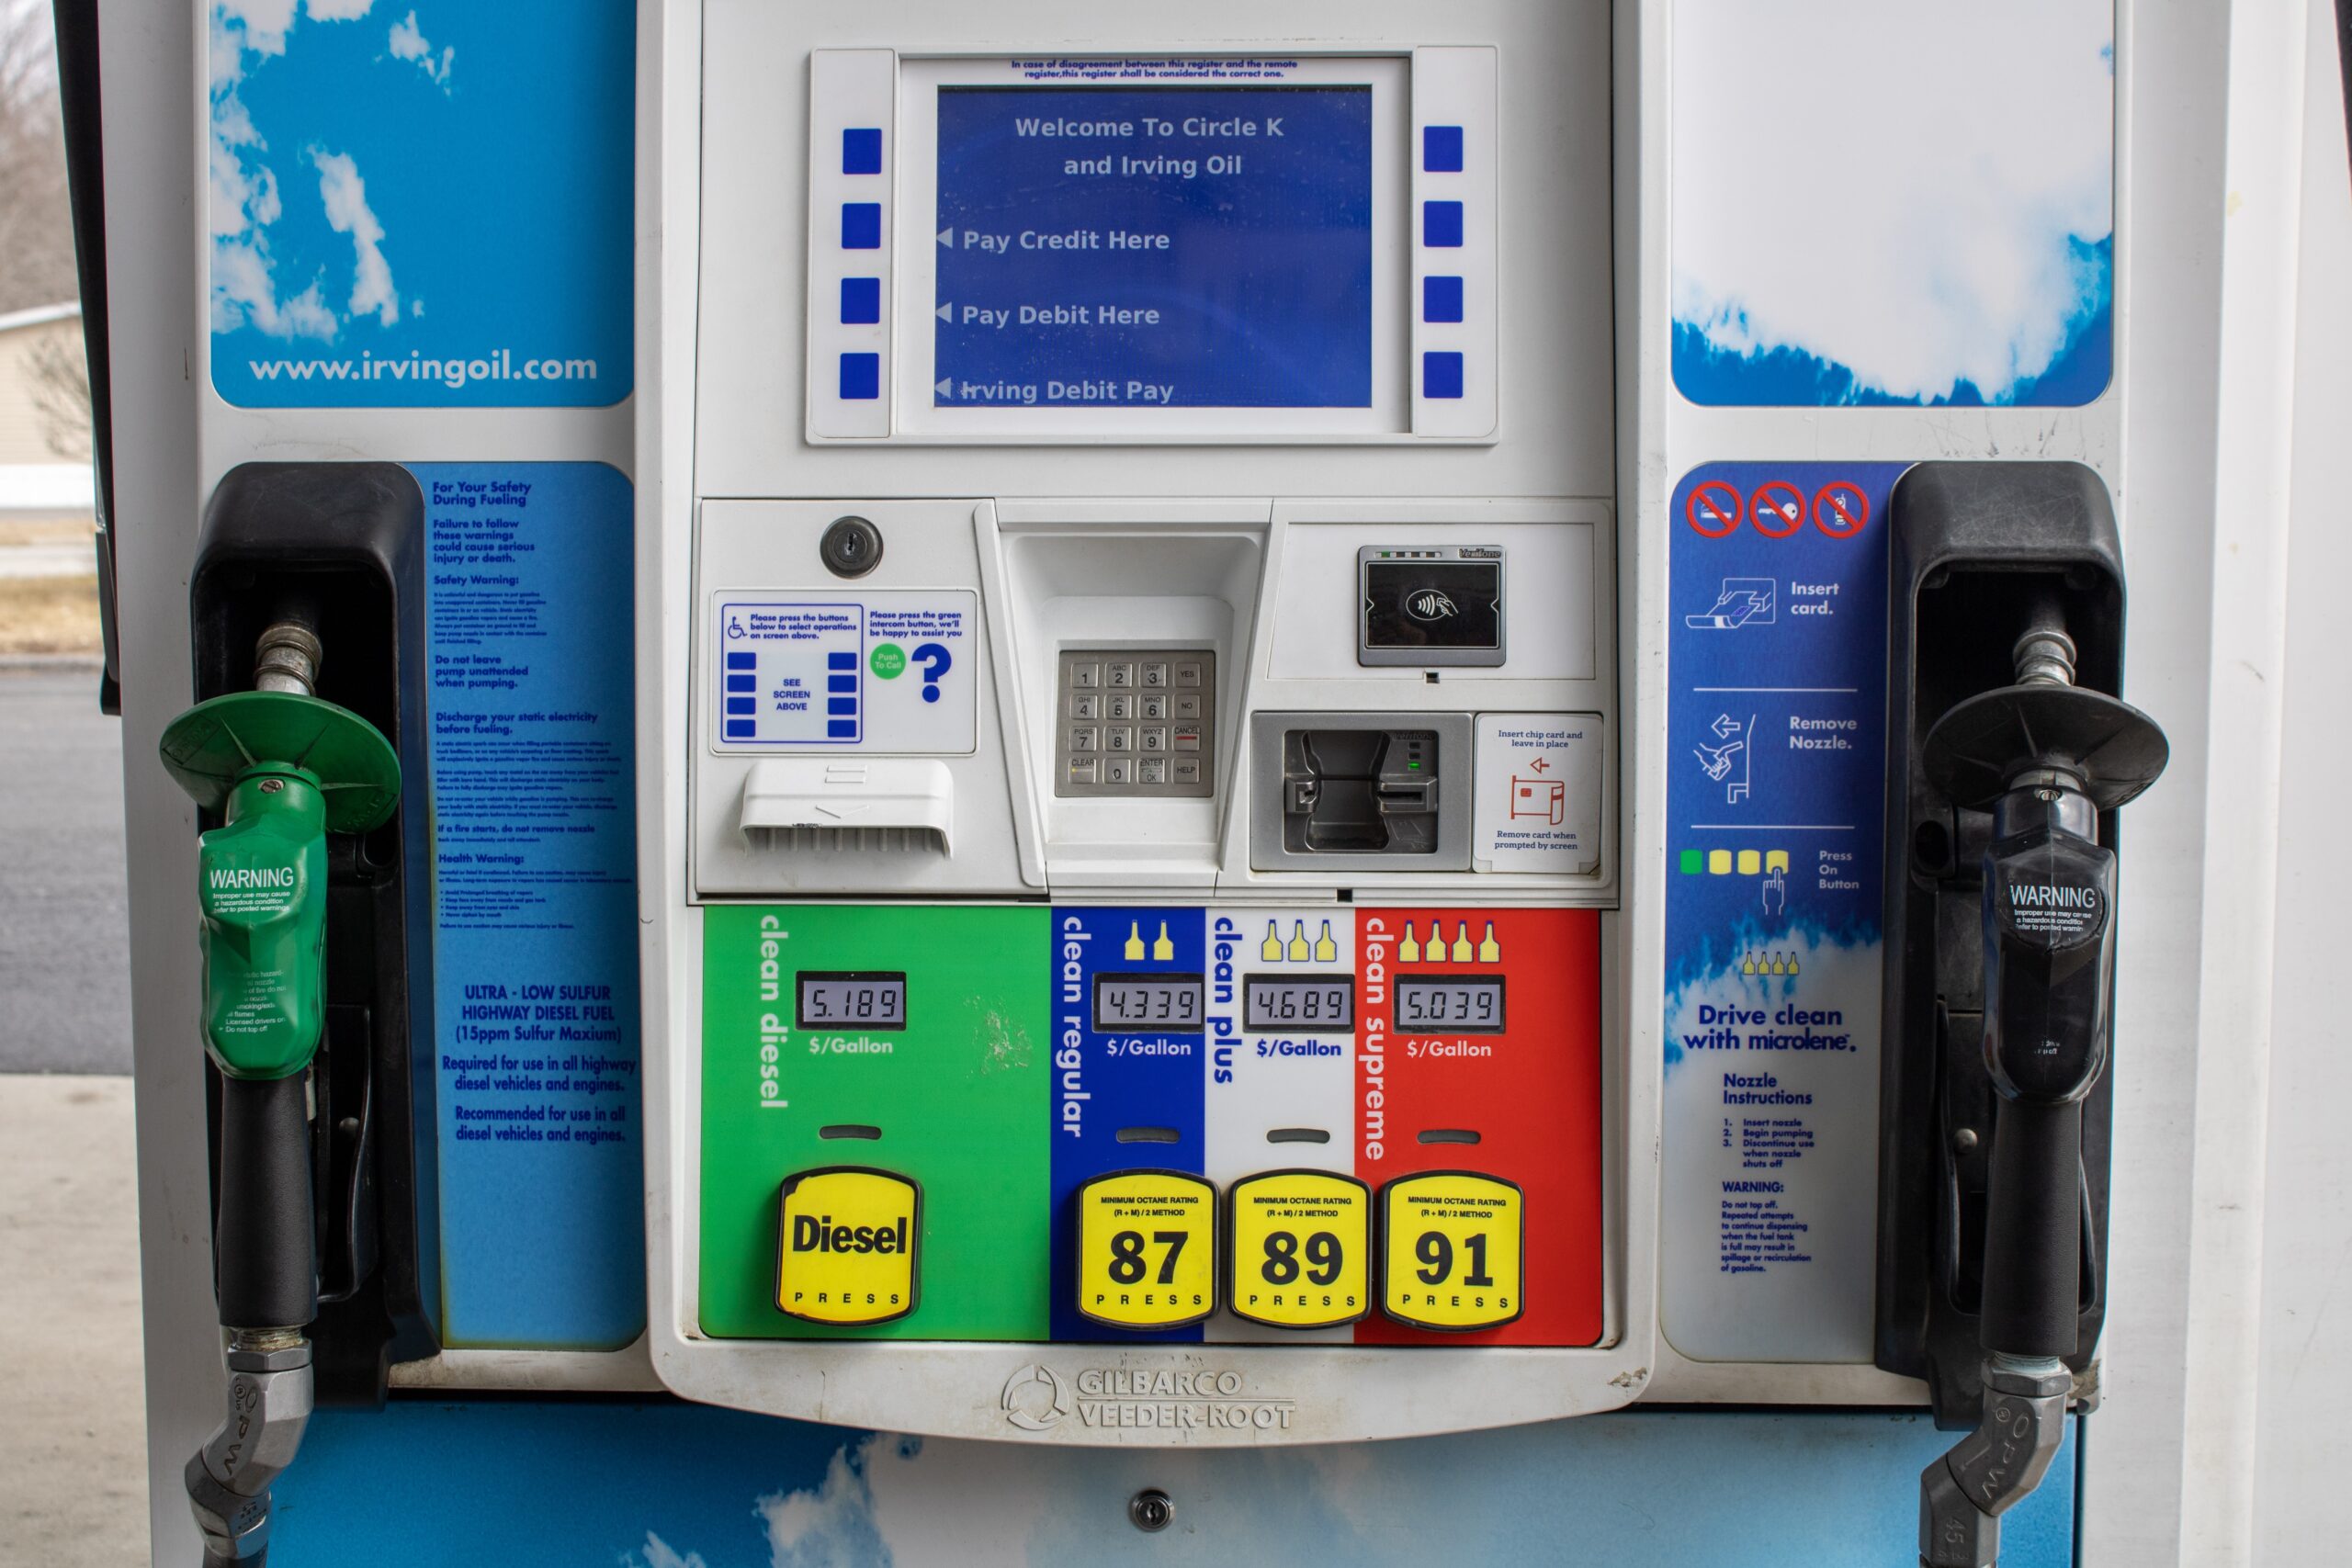
- Within services, increases in housing and utilities (led by housing), “other” services (led by international travel) and health care (led by hospitals) were the largest contributors. Within goods, a decrease in spending on motor vehicles and parts (led by new motor vehicles) was partly offset by an increase in gasoline and other energy goods (led by motor vehicle fuels).
- Personal outlays increased $38.3 billion, while personal saving was $1.01 trillion and the personal saving rate – personal saving as a percentage of disposable personal income – was 5.4%.
- The PCE price index for May increased 6.3% year-over-year, reflecting increases in both goods and services. Energy prices increased 35.8%, while food prices increased 11%. Excluding food and energy, the PCE price index for May increased 4.7% from one year ago.
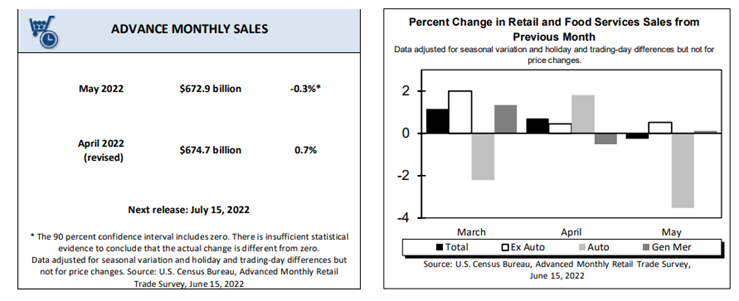
According to the U.S. Census Bureau, advance estimates of U.S. retail and food services sales for May 2022 – adjusted for seasonal variation and holiday and trading-day differences but not for price changes – were $672.9 billion, a decrease of .3% (±0.5%)* from the previous month but 8.1% (±0.7%) higher year-over-year. Total sales for the March 2022 through May 2022 period were up 7.7% (±0.7%) year-over-year. The March 2022 to April 2022 percent change was revised from up .9% (±0.5%) to up .7% (±0.2%). Retail trade sales were down .4% (±0.4%)* from April 2022, but up 6.9% (±0.7%) above last year. Gasoline stations were up 43.2% (±1.6%) year-over-year, while food services and drinking places were up 17.5% (±4%) from last year.
Key Performance Indicators Report — July 2022


