KPI — July 2021: State of the Economy

The Conference Board forecasts real GDP growth in the U.S. will jump to 9% (annualized rate) in Q2 2021 and 6.6% (year-over-year) in 2021. Looking further ahead, The Conference Board estimates 3.8% year-over-year economic growth in 2022 and another 2.5% in 2023.
“As the economy fully reopens and consumer confidence continues to rise, economists predict consumer spending will help drive the recovery forward – especially spending on in-person services. These outlays will be underpinned by a strengthening labor market and a large pool of savings derived from three rounds of fiscal stimulus checks dispersed over the last year,” explained The Conference Board.
Such rapid acceleration in growth has led to rising prices and heightened concerns about inflation. Expected to peak in Q2 2021, the price level for personal consumption expenditures (PCE) – the U.S. Federal Reserve’s preferred inflation metric – is projected to hit 3.5% year-over-year and Core PCE inflation at 2.9%.
“Inflation will likely remain elevated for the remainder of 2021, but then begin to moderate,” noted The Conference Board. “It is unclear whether or not the Fed will tolerate these price increases for an extended period of time, and sooner than expected monetary tightening represents a downside risk to our forecast.”

Employment
Total nonfarm payroll employment jumped 850,000 in June, following increases of 583,000 in May and 269,000 in April, according to the U.S. Bureau of Labor Statistics. The increase marks a significant gain compared to economists’ predictions of approximately 706,000.
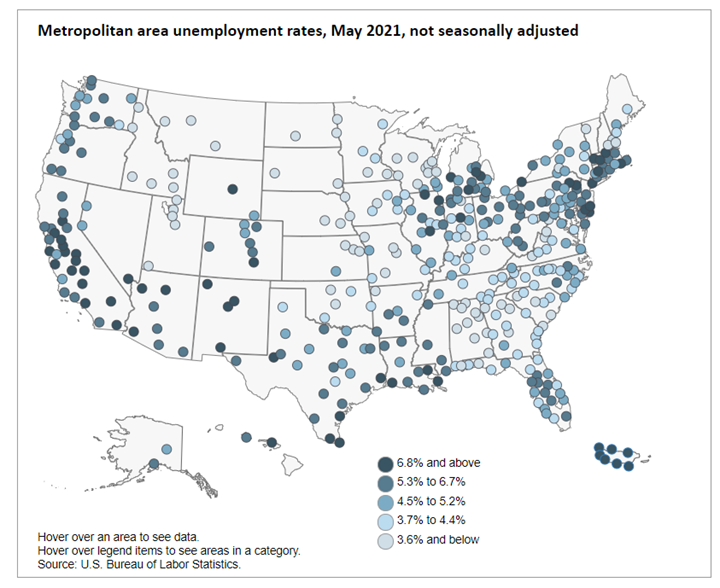
During May, unemployment rates were lower in 21 states and the District of Columbia, higher in one state and stable in 28, according to the U.S. Bureau of Labor Statistics. Nonfarm payroll employment increased in 14 states, decreased in one state and was essentially unchanged in 35 (+District of Columbia). In total, 27 states had unemployment rates lower than the U.S. figure of 5.8%, 12 states (+District of Columbia) posted higher rates and 11 had rates that were not appreciably different from that of the nation.
The national unemployment rate increased from 5.8% in May to 5.9% in June – the latter of which is slightly higher than a forecast of 5.6%. While unemployment is down considerably from its recent high in April 2020, it remains 3.5 percentage points higher than pre-pandemic levels.
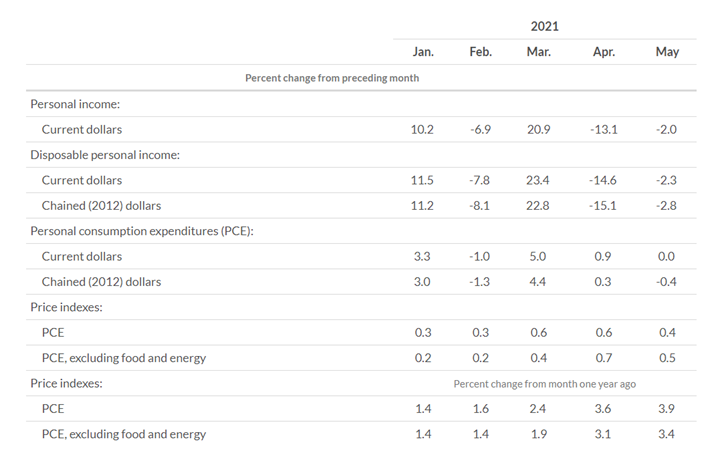
According to the U.S. Bureau of Economic Analysis (BEA), a decrease in personal income in May primarily reflected a decrease in government social benefits. Within government social benefits, “other” social benefits decreased as economic impact payments made to individuals from the American Rescue Plan Act of 2021 continued, but at a lower level than in April. Unemployment insurance also decreased, led by decreases in payments from the Pandemic Unemployment Compensation program, noted the BEA. Personal outlays increased $5.5 billion in May. Personal saving was $2.29 trillion, and the personal saving rate – personal saving as a percentage of disposable personal income – was 12.4%.
Important Takeaways, Courtesy of the Bureau of Labor Statistics:
- Among the unemployed, the number of job leavers – that is, unemployed persons who quit or voluntarily left their previous job and began looking for new employment – increased by 164,000 to 942,000 in June.
- The number of persons on temporary layoff (1.8 million), was essentially unchanged month-over-month. This measure is down considerably from the high of 18 million in April 2020 but remains 1.1 million above the February 2020 level.
- The number of permanent job losers (3.2 million), also was essentially unchanged month-over-month but remains 1.9 million higher than in February 2020.
- The number of long-term unemployed (those jobless for 27 weeks or more) increased by 233,000 to four million, following a decline of 431,000 in May. This measure is 2.9 million higher than in February 2020 and accounted for 42.1% of the total unemployed in June.
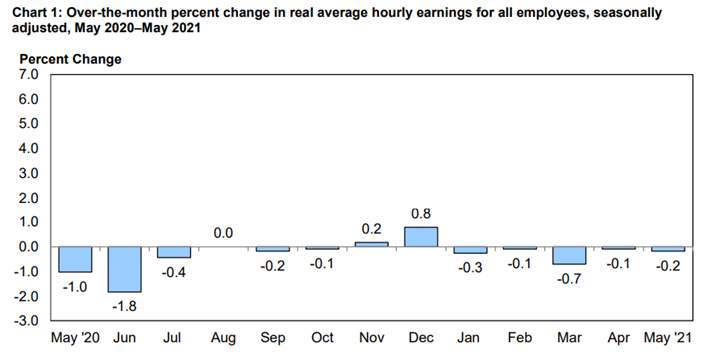
Real average hourly earnings for all employees decreased .2% from April to May (seasonally adjusted), according to the U.S. Bureau of Labor Statistics. This result stems from an increase of .5% in average hourly earnings combined with an increase of .6% in the Consumer Price Index for All Urban Consumers (CPI-U). Real average weekly earnings decreased .1% month-over-month due to the change in real average hourly earnings combined with no change in the average workweek. Real average hourly earnings decreased 2.8% year-over-year (seasonally adjusted). The change in real average hourly earnings combined with an increase of .6% in the average workweek resulted in a 2.2% decrease in real average weekly earnings over this period.
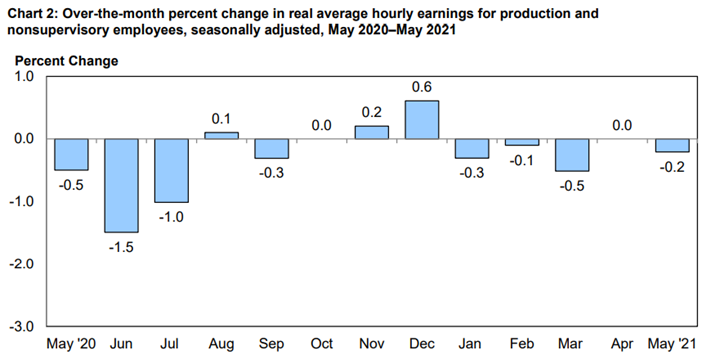
Real average hourly earnings decreased 3% year-over-year (seasonally adjusted). The change in real average hourly earnings combined with a .6% increase in the average workweek resulted in a 2.5% decrease in real average weekly earnings over this period.
By Demographic
Unemployment rates among all major worker groups in June: adult women – 5.5%, adult men – 5.9%, teenagers – 9.9%, Whites – 5.2%, *Asians – 5.8%, Hispanics – 7.4% and Blacks – 9.2%.
Unemployment rates among all major worker groups in April: adult men – 6.1%, adult women – 5.6%, teenagers – 12.3%, Whites – 5.3%, Asians – 5.7%, Hispanics – 7.9% and Blacks – 9.7%.
*Indicates a month-over-month increase.
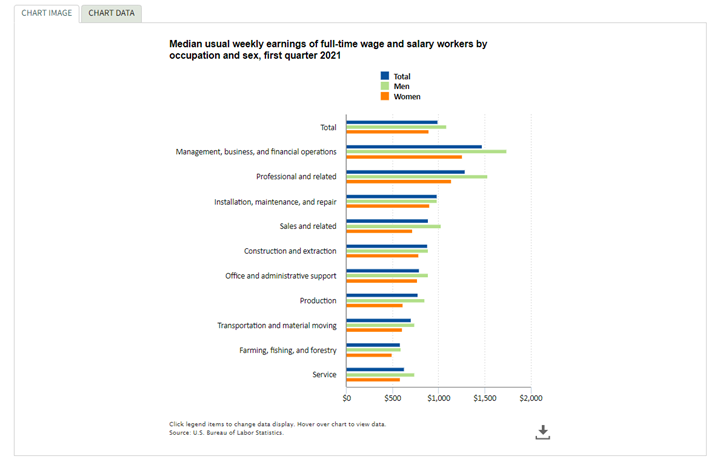
Median weekly earnings of the nation’s 112.1 million full-time wage and salary workers were $989 in the first quarter of 2021, according to the U.S. Bureau of Labor Statistics. Women reported median weekly earnings of $900, or 82.6% of the $1,089 median for men. Full-time workers in management, business and financial operations occupations posted the highest median weekly earnings—$1,741 for men and $1,261 for women. Men and women employed in farming, fishing and forestry jobs had the lowest median weekly earnings in the first quarter of 2021, at $596 and $499, respectively. The ratio of women’s earnings to men’s earnings was highest in installation, maintenance and repair occupations (91.7%).
By Industry
Nonfarm payroll employment is up by 15.6 million since April 2020 but remains down 6.8 million, or 4.4%, compared to pre-pandemic levels in February 2020. In June, notable job gains occurred in leisure and hospitality, public and private education, professional and business services, retail trade, as well as other services.

Important Takeaways, Courtesy of the U.S. Bureau of Labor Statistics:
• Employment in leisure and hospitality increased by 343,000, as pandemic-related restrictions continued to ease in some parts of the country. Over half of the job gain was in food services and drinking places (+194,000). Employment also increased in accommodation (+75,000) and in arts, entertainment and recreation (+74,000). Employment in leisure and hospitality is down by 2.2 million, or 12.9%, compared to February 2020.
• Employment rose by 155,000 in local government education, 75,000 in state government education and 39,000 in private education. In both public and private education, staffing fluctuations due to the pandemic, in part reflecting the return to in-person learning and other school-related activities, have distorted the normal seasonal buildup and layoff patterns, likely contributing to the job gains in June. (Without the typical seasonal employment increases earlier, there were fewer layoffs at the end of the school year, resulting in job gains after seasonal adjustment.) These variations make it more challenging to discern the current employment trends in these industries. Since February 2020, employment is down by 414,000 in local government education, 168,000 in state government education and 255,000 in private education.
• Employment in wholesale trade added 21,000 jobs, with gains in both the durable and nondurable goods components (+14,000 and +9,000, respectively). Employment in wholesale trade is 192,000 lower than February 2020.
• Employment in manufacturing was relatively unchanged (+15,000). Within the industry, job gains in furniture and related products (+9,000), fabricated metal products (+6,000) and primary metals (+3,000) were partially offset by a loss in motor vehicles and parts (-12,000). Employment in manufacturing is down by 481,000 compared to February 2020.
• Employment in transportation and warehousing was relatively unchanged (+11,000). Employment gains in warehousing and storage (+14,000), air transportation (+8,000) and truck transportation (+6,000) were partially offset by a loss in couriers and messengers (-24,000). Since February 2020, employment in transportation and warehousing is down 94,000.
• Employment in mining increased by 10,000 in June, reflecting a gain in support activities for mining. Mining employment is down by 110,000 since a peak in January 2019.
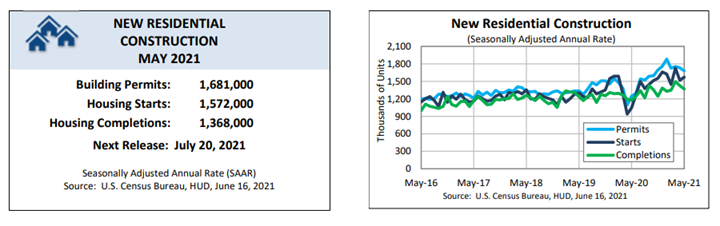
• Construction employment was relatively unchanged (-7,000). Month-over-month job losses in non-residential specialty trade contractors (-15,000) and heavy and civil engineering construction (-11,000) were partially offset by a gain in residential specialty trade contractors (+13,000). Employment in construction is 238,000 lower compared to February 2020.
KPI — July 2021: Consumer Trends
Key Performance Indicators Report — July 2021


