- KPI – January 2026: State of Business – Automotive Industry
- KPI – January 2026: State of Manufacturing
- KPI – January 2026: State of the Economy
- KPI – January 2026: Consumer Trends
- KPI – January 2026: Recent Vehicle Recalls
In December, the Fiserv Small Business Index was 143.7—posting a year-over-year gain of 1.6% and a month-over-month increase of 0.8%. The Fiserv Small Business Transaction Index stood at 103.3, posting a year-over-year decline of 0.4% but remaining flat month-over-month. These results highlight steady sales growth despite slight transaction challenges.
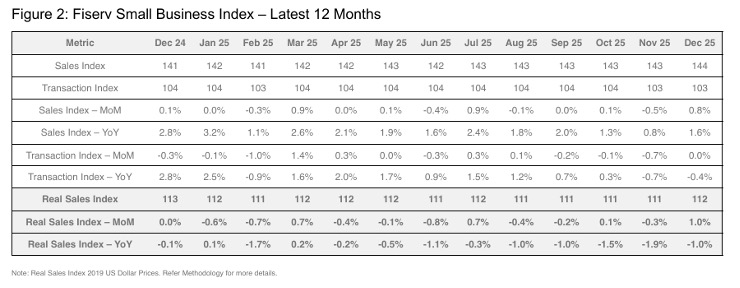
Key Takeaways, Courtesy of The Fiserv Small Business Sales Index:
- Higher average tickets (+2% year-over-year, +0.9% month-over-month) drove overall sales growth. Increased holiday shopping demand may have encouraged consumers to spend a little more, but it is also possible that latent tariff impacts are now impacting small businesses, and they are passing their cost increases on to consumers.
- The Fiserv Small Business Index for Professional, Scientific and Technical Services in the U.S. increased by 6.8% year-over-year, while the Real Fiserv Small Business Index rose by 4.1% year-over-year, reflecting a long-term shift. The Fiserv Small Business Index for December 2025 grew by 1.7% month-over-month, and the Real Fiserv Small Business Index increased by 1.8% month-over-month, indicating a short-term pattern. Additionally, the Fiserv Small Business Transaction Index for Specialty Trade Contractors in the U.S. grew by 6.9% year-over-year, highlighting foot traffic.
- In December, Sales of Essentials grew 2.8%, while discretionary sales grew 0.7%, a pattern that has persisted even through the holiday period. It is important to note that small business grocery stores, which are a significant portion of essential sales, actually declined 0.3% year-over-year despite a foot traffic increase. This result suggests a combination of consumer pricing pressure and deal-hunting. Goods and Services followed a similar pattern, with Goods sales growth of 0.7% year-over-year and Services sales growth of 2%.
- Restaurant sales were muted in December. Sales growth was 0.1% year-over-year, with no growth month-over-month. Eroding foot traffic was the key driver of underperformance. Limited-Service Restaurants (0.5% year-over-year) once again outperformed Full-Service Restaurants (-0.6% year-over-year), while bars saw 1% growth, driven entirely by increased foot traffic.
Despite facing extraordinary economic pressure, the small business sector continues to demonstrate perseverance. The NFIB Small Business Optimism Index registered 99.5 in December—up 0.5 points month-over-month. Of the 10 Optimism Index components, two increased, three decreased and five were unchanged. An increase in those expecting better business conditions primarily drove the rise in the Optimism Index. The Uncertainty Index fell seven points to 84, the lowest reading since June 2024.
“2025 ended with a further increase in small business optimism. While Main Street business owners remain concerned about taxes, they anticipate favorable economic conditions in 2026 due to waning cost pressures, easing labor challenges and an increase in capital investments,” says Bill Dunkelberg, NFIB chief economist.
Important Takeaways, Courtesy of NFIB:
- 20% of small business owners reported taxes as their single most important problem, up six points from November and ranking as the top problem. This is the highest reading since May 2021.
- Both actual and planned prices fell month-over-month. The net percent of owners raising average selling prices fell four points from November to a net 30% (seasonally adjusted). A net 28% (seasonally adjusted) plan to increase prices in the next three months (down two points).
- A net negative 3% of owners reported paying a higher interest rate on their most recent loan, down five points from November and the lowest reading since January 2021.
- The net percent of owners expecting better business conditions rose nine points from November to a net 24% (seasonally adjusted), contributing the most to the rise in the Optimism Index. This was the first increase since July.
- When asked to evaluate the overall health of their business, 9% rated it excellent (down two points), 54% rated it good (up one point), 34% rated it fair (up four points) and 3% rated it poor (down two points).
- The net percent of owners reporting inventory gains rose six points to a net negative 1% (seasonally adjusted), the highest reading of the year.
- 64% of small business owners reported that supply chain disruptions were affecting their business to some degree, unchanged from November. Beneath simple yes/no impact binary, there was a positive shift from those reporting a significant impact to those reporting a moderate or mild impact.
Professionals in the automotive, RV and powersports industries remain steadfast in their efforts to evolve their business models and grow their brands in the face of adversity. As such, the monthly Key Performance Indicator Report serves as an objective wellness check on the overall health of our nation, from the state of manufacturing and vehicle sales to current economic conditions and consumer trends. Below are a few key data points explained in further detail throughout the report.
Key Data Points:
- In December, economic activity in the manufacturing sector contracted for the 10th consecutive month, following a two-month expansion preceded by 26 straight months of contraction, according to the nation’s supply executives in the latest ISM Manufacturing PMI Report. The Manufacturing PMI registered 47.9%, the lowest reading of 2025.
- With 91.9 million units sold, 2025 Global Light Vehicle (LV) sales were up 3.6% year-over-year.
- Total new vehicle sales for January 2026, including retail and non-retail transactions, are projected to reach 1,118,700—a 2.7% decrease year-over-year, according to a joint forecast from J.D. Power and GlobalData.
- According to the quarterly forecast prepared by ITR Economics for the RV Industry Association (RVIA), RV wholesale shipments in 2025 are projected to climb slightly to 337,000 units and then see continued growth to the mid-300,000 unit range in 2026.
- Powersports Business says dealers across the country reported a decline of 2.5% in combined same-store sales compared to the same month last year, according to composite data from more than 1,700 dealerships in the U.S. that utilize CDK Lightspeed DMS. On average, dealerships were down 6.6% in major units, 11.7% in parts and .5% in service.
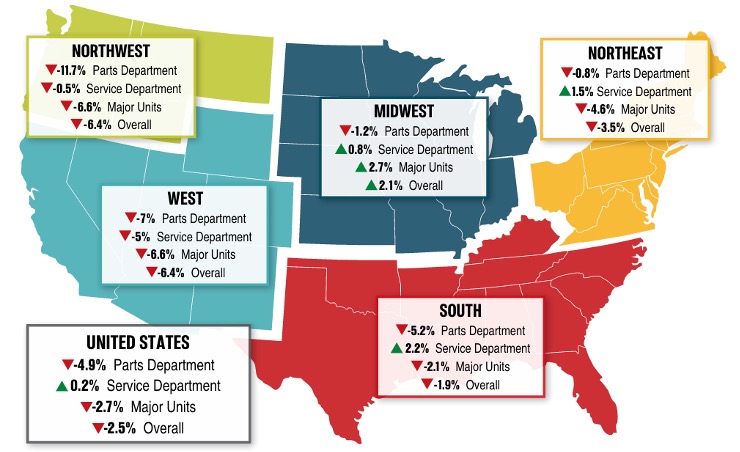
Image Source: Powersports Business


