- KPI – January 2026: The Brief
- KPI – January 2026: State of Manufacturing
- KPI – January 2026: State of Business – Automotive Industry
- KPI – January 2026: State of the Economy
- KPI – January 2026: Recent Vehicle Recalls
Below is a synopsis of consumer sentiment, confidence, demand and income/spending trends.
Sentiment
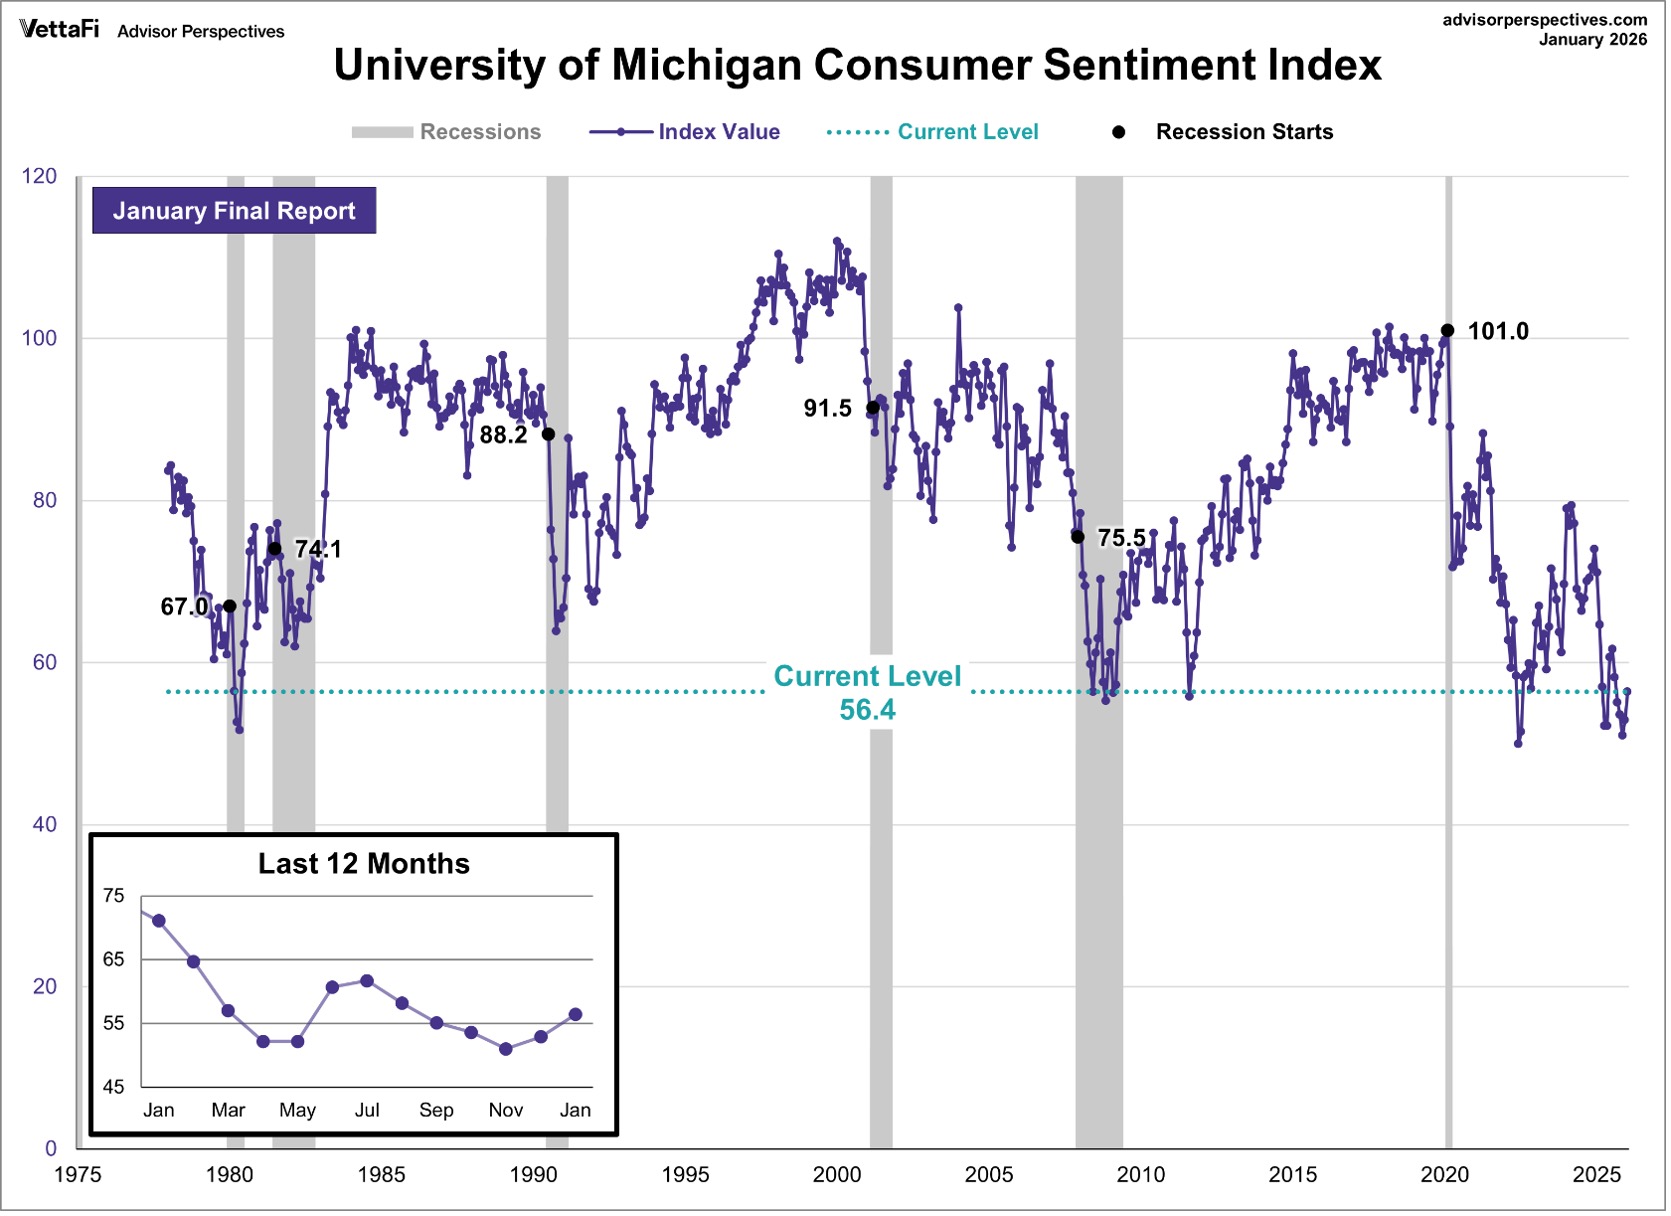
The University of Michigan Survey of Consumers—a survey consisting of approximately 50 core questions covering consumers’ assessments of their personal financial situation, buying attitudes and overall economic conditions—registered 52.9 in December and posted a preliminary reading of 56.4 in January.
Data shows consumer sentiment increased approximately 3.5 index points, with minor gains seen across all index components. The overall improvement was small but broad-based, apparent across income distribution, educational attainment, older and younger consumers, as well as Republicans and Democrats alike.
“However, national sentiment remains more than 20% below a year ago, as consumers continue to report pressures on their purchasing power stemming from high prices and the prospect of weakening labor markets. Aside from tariff policy, consumers do not appear to be connecting foreign developments to their views of the economy,” says Joanne Hsu, director at Survey of Consumers.
Key Takeaways, Courtesy of Survey of Consumers:
- Year-ahead inflation expectations fell back to 4% this month—the lowest reading since January 2025 but “well above” that month’s 3.3%.
- Long-run inflation expectations inched up from 3.2% last month to 3.3% this month. In comparison, readings ranged between 2.8% and 3.2% in 2024 and were below 2.8% throughout 2019 and 2020. Uncertainty over short-run inflation expectations, as measured by the interquartile range of responses, has fallen from mid-2025 but remains considerably elevated in recent months, comparable to levels seen in 2022.
Confidence
The Conference Board Consumer Confidence Index dropped by 9.7 points in January to 84.5 (1985=100). A 5.1-point upward revision to December’s reading of the Index resulted in a slight increase last month, reversing the initially reported decline. However, January’s preliminary results showed confidence resumed declining after a one-month uptick.
The Present Situation Index—based on consumers’ assessment of current business and labor market conditions—declined 9.9 points to 113.7 in January. The Expectations Index—based on consumers’ short-term outlook for income, business and labor market conditions—fell by 9.5 points to 65.1, well below the threshold of 80 that usually signals a recession ahead.
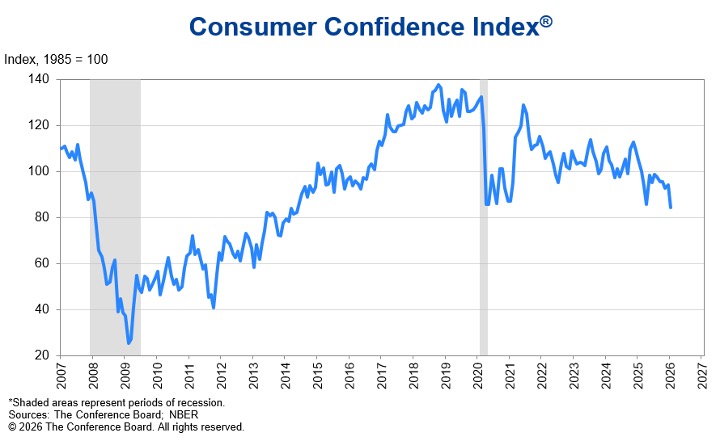
“Confidence collapsed in January, as consumer concerns about both the present situation and expectations for the future deepened,” says Dana Peterson, chief economist at The Conference Board. “All five components of the Index deteriorated, driving the overall Index to its lowest level since May 2014 (82.2)—surpassing its COVID-19 pandemic depths.”
While confidence dipped for all age groups in January, consumers under 35 continued to be more confident than consumers aged 35 and older. Confidence among all generations trended downward in the month, but Gen Z remained the most optimistic of all generations surveyed. By income, confidence on a six-month moving average basis ticked downward for all brackets. Consumers earning less than $15K remained the least optimistic among all income groups. Consumer confidence continued to fade in January among all political affiliations, with the sharpest decline among Independents.
Key Takeaways, Courtesy of The Conference Board:
- Several weeks after the Federal Reserve cut monetary policy rates in December, the share of consumers expecting interest rates to be higher 12 months from now dipped in January. Consumers’ average 12-month inflation expectations bounced up, but the median fell further. The balance of consumers’ expectations for stock prices twelve months from now—higher minus lower—retreated after a pop.
- On net, consumers’ views of their Family’s Current Financial Situation improved slightly in January, after a plunge into negative territory in December was revised upward to reveal a small net positive.
- The share of consumers believing a U.S. recession over the next 12 months is “somewhat likely” edged downward, as did the share who said “not likely.” The share who said a recession is “very likely” ticked back up, and the small percentage who said the U.S. is “already in one” crept higher.
- Consumers appeared more cautious about plans for buying big-ticket items over the next six months. Consumers who said “yes” to buying big-ticket items ahead declined in January, while those who said “maybe” rose and “no” edged higher. On a six-month moving average basis, expectations for purchasing new cars continued to falter, but plans to buy used cars climbed higher. Homebuying expectations continued to retreat. Plans to purchase refrigerators, dishwashers, furniture and TVs decreased. Likewise, plans to buy electronics dipped in all categories besides smartphones, which continued to trend upward on a six-month moving average basis. Used cars, furniture, TVs and smartphones remained the most popular within their categories for future purchases.
“Consumers’ write-in responses on factors affecting the economy continued to skew towards pessimism. References to prices and inflation, oil and gas prices, as well as food and grocery prices, remained elevated. Mentions of tariffs and trade, politics and the labor market also rose in January, and references to health/insurance and war edged higher,” Peterson says.
Consumer Income & Spending
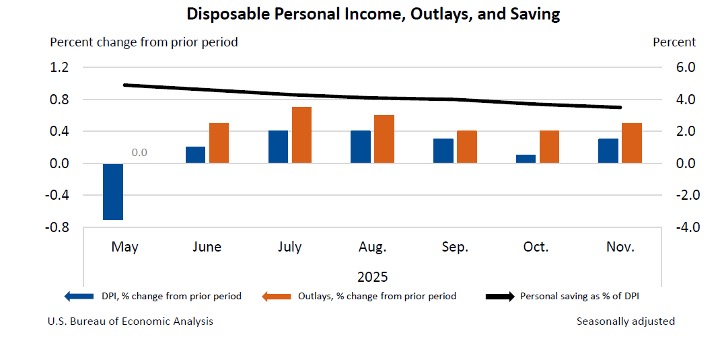
In October, personal income increased $30.6 billion (0.1% at a monthly rate), according to the U.S. Bureau of Economic Analysis. In addition, disposable personal income (DPI)—personal income less personal current taxes—increased $12 billion (0.1%), followed by an increase of $63.7 billion (0.3%). Personal consumption expenditures (PCE) increased $98.6 billion (0.5%) in October and $108.7 billion (0.5%) in November.
Personal outlays—the sum of PCE, personal interest payments and personal current transfer payments—increased $97.8 billion in October, followed by an increase of $107.9 billion in November. Personal saving was $843.9 billion and $799.7 billion, respectively. The personal saving rate—personal saving as a percentage of disposable personal income—was 3.7% in October and 3.5% in November.
In October, the $98.6 billion increase in current-dollar PCE reflected increases in both services and goods. The increase in spending on services was led by financial services and insurance, health care, and housing and utilities. Meanwhile, the increase in spending on goods was led by recreational goods and vehicles, other nondurable goods, plus clothing and footwear.
In November, the $108.7 billion increase in current-dollar PCE reflected increases in both services and goods. Health care, financial services and insurance, as well as other services, led the increase in services, while gasoline and other energy goods, motor vehicles and parts directed the uptick in goods.
Key Takeaways, Courtesy of the U.S. Bureau of Economic Analysis:
- The PCE price index increased 0.2% month-over-month in both October and November. Excluding food and energy, the PCE price index also increased 0.2% in both months.
- The PCE price index increased 2.7% year-over-year in October, followed by an increase of 2.8% in November. Excluding food and energy, the PCE price index increased at the same rates in October and November.


