KPI – January 2025: State of the Economy
There are still plenty of questions to answer as businesses dive into the new year…

- KPI – January 2025: The Brief
- KPI – January 2025: Recent Vehicle Recalls
- KPI – January 2025: State of Business – Automotive Industry
- KPI – January 2025: State of Manufacturing
- KPI – January 2025: Consumer Trends
In December, the Consumer Price Index for All Urban Consumers (CPI-U) increased 0.4% on a seasonally adjusted basis after rising 0.3% in November, according to the U.S. Bureau of Labor Statistics. Over the last 12 months, the all-items index increased 2.9% before seasonal adjustment.
Important takeaways, courtesy of the U.S. Bureau of Labor Statistics:
- The index for energy rose 2.6% in December, accounting for over 40% of the monthly all-items increase. In addition, the gasoline index increased 4.4% month-over-month. The index for food was up, increasing 0.3% as both the index for food-at-home and the index for food-away-from-home increased 0.3% each.
- Indexes on the rise include shelter, airline fares, used cars and trucks, new vehicles, motor vehicle insurance and medical care. The indexes for personal care, communication and alcoholic beverages were among the few major indexes to decrease.
- The all-items index increased 2.7% year-over-year, after rising 2.6% in October. The all-items-less-food-and-energy index rose 3.3% during the same period. The energy index decreased 3.2%, while the food index increased 2.4% year-over-year.

While economic experts say inflation is “cooling,” consumers are still wrestling stubbornly high prices at the grocery store and gas pump. Click here for recent data detailing increases since November 2020.
EMPLOYMENT
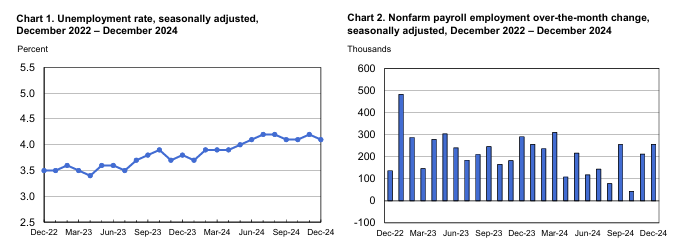
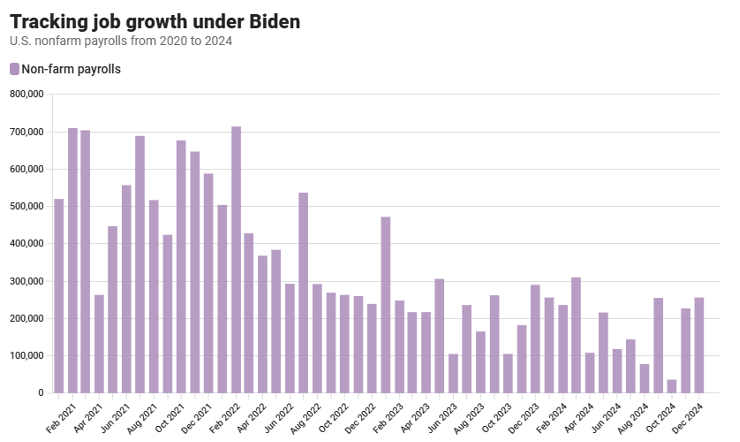
Total nonfarm payroll employment increased by 256,000 in December—well above estimates. Employment was up in health care, government and social assistance. The unemployment rate and number of unemployed persons edged down to 4.1% and 6.9 million, respectively.
“You’re never going to hear me complain that we got 250,000 jobs,” says Austan Goolsbee, president at Chicago Fed. “I think it’s a strong jobs report. It makes me further comfortable that the job market is stabilizing at something like the full employment rate.”
According to the U.S. Bureau of Labor Statistics, labor force participation and long-term unemployed (those jobless for 27 weeks or more) rates were relatively unchanged at 62.5% and 22.4%, respectively. In addition, categories like discouraged workers and those holding part-time jobs for economic reasons were relatively unchanged month-over-month but remain elevated—the latter of which is up from 4 million to 4.4 million people year-over-year.
Average hourly earnings increased 0.3% month-over-month and 3.9% over the past year, the former of which is in line with forecasts. While the 12-month data registered slightly below the outlook, economists say it is indicative of wage inflation becoming less of a factor. The average workweek held steady at 34.3 hours.
“The surprisingly strong jobs report certainly isn’t going to make the Fed less hawkish,” says Ellen Zentner, chief economic strategist for Morgan Stanley Wealth Management.
“You have to think that (Fed Chair) Jerome Powell is breathing a sigh of relief in the sense that his job just got a little bit easier. Inflation hasn’t been moving anywhere for months, so there’s no incentive to cut rates. Now you get this (jobs report), so you don’t need to cut rates to stimulate the economy,” adds Dan North, senior economist for North America at Allianz Trade.

Regular monthly job revisions continue to be a troubling trend that industry professionals are monitoring closely.
The Bureau revised its data by 57,000 in April, lowering its previous estimate of 165,000 jobs added to 108,000. Likewise, May payroll estimates were revised down 54,000 jobs—decreasing total job gains from 272,000 to 218,000. That is a combined 111,000 fewer jobs in April and May than first reported, which brings the three-month average of job gains to roughly 177,000—well below the 269,000 recorded during the first three months of the year.
Job creation in June was slashed by 61,000 (from a gain of 179,000 to 118,000), while July erased 25,000 (from a gain of 114,000 to 89,000). With the revision, July’s job creation was the lowest nonfarm payrolls reading since December 2020.
More recently, August and September fell victim to downward revisions. The former was revised down by 81,000 from a gain of 159,000 to 78,000, while the latter was revised down by 31,000 from a gain of 254,000 to 223,000. Total nonfarm payroll employment registered 12,000 in October—the lowest tally since December 2020—then was swiftly upwardly revised by 36,000.
BY DEMOGRAPHIC
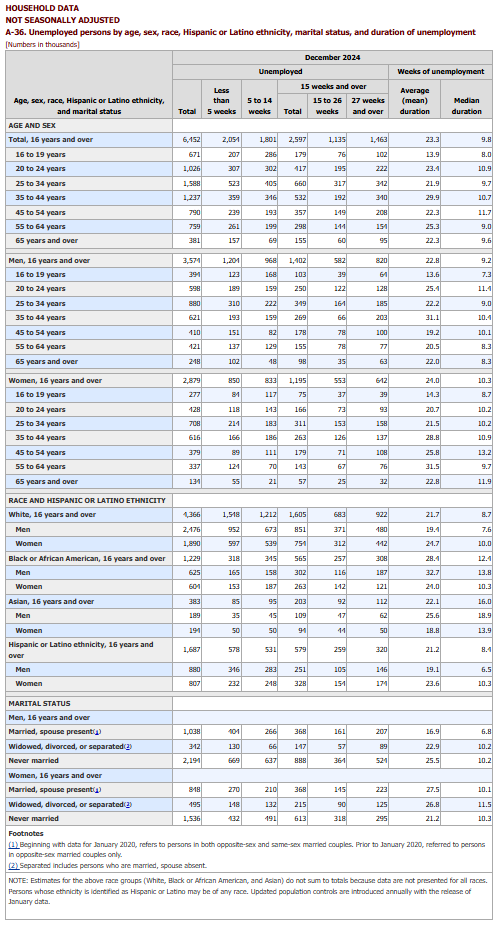
This month, unemployment rates among the major worker groups are: adult women – 3.8%; adult men – 3.7%; teenagers – 12.4%; Asians – 3.5%; Whites – 3.6%; Hispanics – 5.1%; and Blacks – 6.1%.
Last month, unemployment rates among the major worker groups were: adult women – 3.9%; adult men – 3.9%; teenagers – 13.2%; Asians – 3.8%; Whites – 3.8%; Hispanics – 5.3%; and Blacks – 6.4%.

Source: U.S. Bureau of Labor Statistics data

BY INDUSTRY
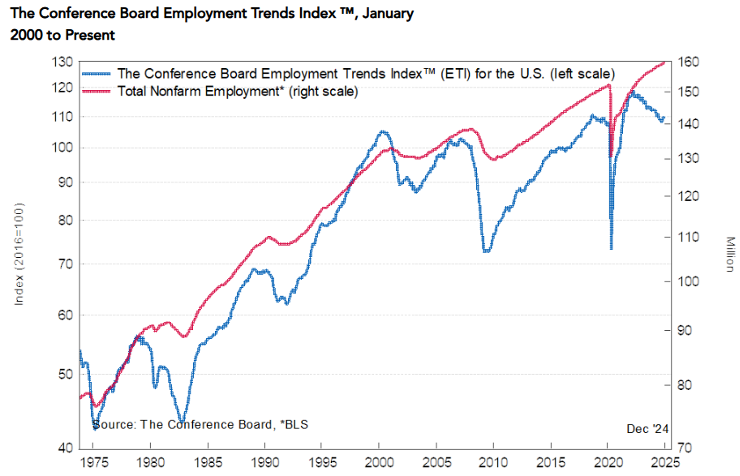
The Conference Board Employment Trends Index (ETI) was relatively unchanged month-over-month, ticking up from 109.45 in November to 109.70 in December.
“The ETI extended its streak of gains to three months in December,” says Mitchell Barnes, economist at The Conference Board. “That closes 2024 with the index at its highest level since June, suggesting that the steady labor market normalization we’ve seen since 2022 may have reached its nadir in mid-2024. The slight improvement in the ETI we’ve seen since reflects the labor market’s resilience entering 2025.”
According to Barnes, the labor market continues to self-balance, calming recent concerns about unemployment and broader softening. ETI data shows initial claims for unemployment insurance, on a four-week moving average basis through the first week of January, remain at the lowest level since last April. In addition, the share of involuntary part-time workers declined four months in a row.
He says employment in the temporary-help industry also posted two consecutive months of expansion amid broader hiring gains in November and December.
“December data highlights that the labor market continues on stable footing, even after a long period of normalization during the post-pandemic recovery,” Barnes notes. “High employment and wage growth have continued to support strong consumer spending, and we expect labor demand to remain stable as businesses await an uncertain policy and economic environment next year.”

The Employment Trends Index is a leading composite index for payroll employment. When the Index increases, employment is likely to grow as well, and vice versa. Turning points in the Index indicate that a change in the trend of job gains or losses is about to occur in the coming months.
Important takeaways, courtesy of the U.S. Bureau of Labor Statistics:
- Health care added 46,000 jobs in December, with gains in home health care services (+15,000), nursing and residential care facilities (+14,000), as well as hospitals (+12,000). Health care added an average of 57,000 jobs per month in 2024, the same as the average monthly gain in 2023.
- Retail trade added 43,000 jobs, following a loss of 29,000 jobs in November. Employment increased in clothing, clothing accessories, shoe and jewelry retailers (+23,000); general merchandise retailers (+13,000); and health and personal care retailers (+7,000). Building material and garden equipment and supplies dealers lost jobs (-11,000). Overall, employment in retail trade changed little in 2024, following an average monthly increase of 10,000 in 2023.
- Government employment continued to trend up (+33,000). Government added an average of 37,000 jobs per month in 2024, below the average monthly gain of 59,000 in 2023. Employment continued to trend up in state government month-over-month (+10,000).
- Employment in social assistance increased by 23,000, mostly in individual and family services (+17,000). Social assistance added an average of 18,000 jobs per month in 2024, below the average increase of 23,000 per month in 2023.
Click here to review more employment details.


