KPI – January 2025: Consumer Trends
While no clear trends are emerging early in the year, elevated prices remain top of mind…

- KPI – January 2025: The Brief
- KPI – January 2025: State of Manufacturing
- KPI – January 2025: State of Business – Automotive Industry
- KPI – January 2025: State of the Economy
- KPI – January 2025: Recent Vehicle Recalls
Below is a synopsis of consumer confidence, sentiment, demand and income/spending trends.
The University of Michigan Survey of Consumers—a survey consisting of approximately 50 core questions covering consumers’ assessments of their personal financial situation, buying attitudes and overall economic conditions—registered 74 in December, up from 71.8 a month prior. The preliminary January reading is 73.2.
Data shows assessments of personal finances improved approximately 5%, while the economic outlook dipped 7% for the short run and 5% for the long run.
According to Survey of Consumers, January’s divergence in views of the present and the future reflects easing concerns over the current cost of living this month but surging worries over the future path of inflation. A deterioration in the expectations index was prevalent across political affiliations, including 3% and 1.5% declines among Independents and Republicans, respectively.
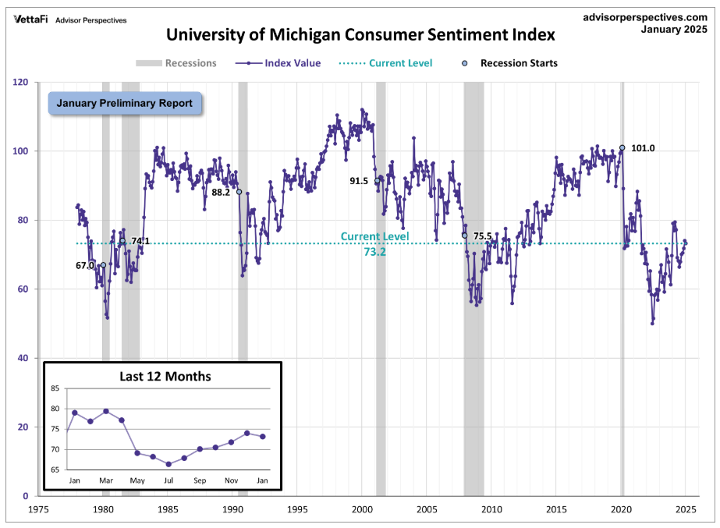
“For both the short and long run, inflation expectations rose across multiple demographic groups, with particularly strong increases among lower-income consumers and Independents,” says Joanne Hsu, director of Survey of Consumers. “Note that inflation uncertainty—as estimate using the interquartile range in inflation expectations—has climbed considerably over the past year.”
Takeaways, courtesy of Survey of Consumers:
- Year-ahead inflation expectations soared from 2.8% last month to 3.3% this month – the highest reading since May 2024 and above the 2.3-3.0% range seen in the two years prior to the pandemic.
- Long-run inflation expectations rose from 3% last month to 3.3% this month. It is only the third time in the last four years that long-run expectations have exhibited such a large one-month change.
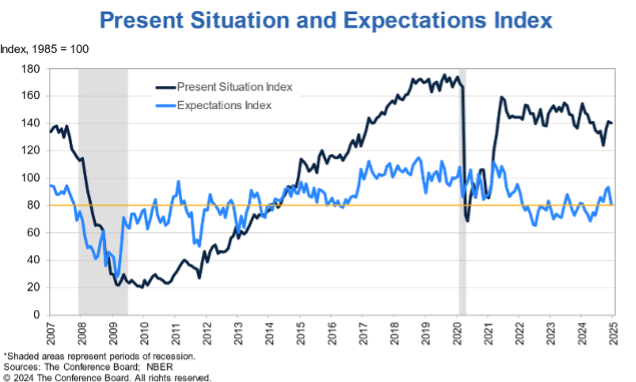
Likewise, the Conference Board Consumer Confidence Index slid from 111.7 in November to 104.7 (1985 = 100) in December – an 8.1-point difference. The Present Situation Index—based on consumers’ assessment of current business and labor market conditions—dropped 1.2 points (140.2). Meanwhile, the Expectations Index—based on consumers’ short-term outlook for income, business and labor market conditions—dropped 12.6 points to 81.1.
“While weaker consumer assessments of the present situation and expectations contributed to the decline, the expectations component saw the sharpest drop. Consumer views of current labor market conditions continued to improve, consistent with recent jobs and unemployment data, but their assessment of business conditions weakened,” says Dana M. Peterson, chief economist at The Conference Board.
Compared to last month, she says consumers were “substantially less optimistic” about future business conditions and incomes. Moreover, pessimism about future employment prospects returned after cautious optimism prevailed in October and November. Such analysis is seemingly in conflict with other recent data, courtesy of Fiserv Small Business Index and The NFIB Small Business Optimism Index.
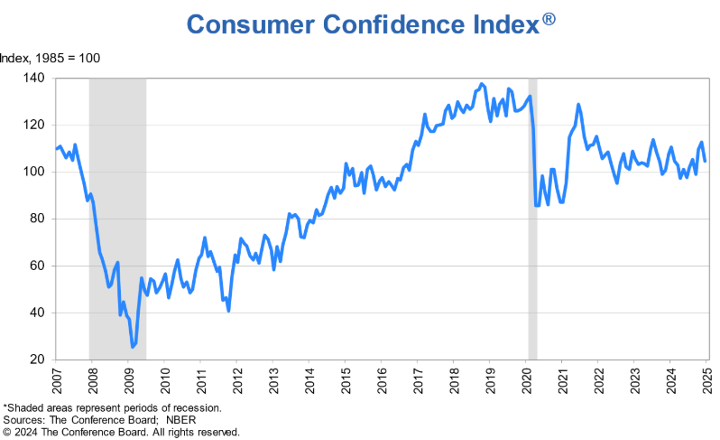
Important takeaways, courtesy of The Conference Board:
- The outcome of the November election is impacting consumers’ views of the economy. Nearly 46% of U.S. consumers expect tariffs to raise the cost of living while 21% expected tariffs to create more U.S. jobs.
- Consumers were “slightly less bullish” about the stock market in December: 52.9% expected stock prices to increase in the year ahead, down from a record high of 57.2% in November. Meanwhile, 25% of consumers expected stock prices to decline, up from 21.7%.
- Data shows the share of consumers expecting higher interest rates over the next 12 months ticked up to 48.5% but remained near recent lows. The share expecting lower rates eased to 29.3%—”down from recent months but still quite high.”
- Average 12-month inflation expectations stabilized at 5% in December, the lowest since March 2020. According to The Conference Board, references to inflation and prices dominated write-in responses. Consumers expect food and gas prices to be more affordable in 2025.
According to The Conference Board, the decrease in confidence was led by consumers over 35 years old, while consumers under 35 became more confident. The decline was concentrated among household earnings between $25,000 and $100,000, while consumers at the bottom and top of the income range reported only limited changes in confidence. On a six-month moving average basis, consumers under 35 and those earning over $100,000 remained the most confident.
“The proportion of consumers anticipating a recession over the next 12 months was stable near the series low. Meanwhile, consumers’ assessments of their Family’s Financial Situation—both current and over the next six months—weakened,” Peterson says.
Elevated prices remain top of mind. On a six-month moving average basis, purchasing plans for homes, appliances, electronics and travel spending intentions were down in December—the former of which potentially reflects rising mortgage rates (despite Fed rate cuts). Purchasing plans for autos and services (dining out, streaming, personal care and health care) were on the rise.
CONSUMER INCOME & SPENDING
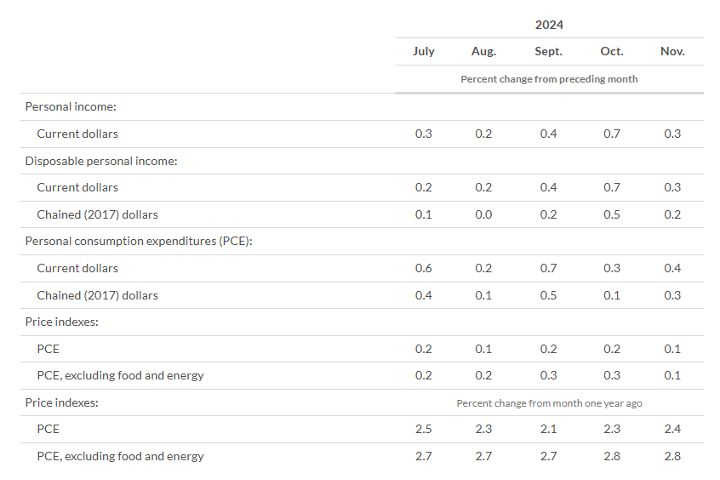
According to the U.S. Bureau of Economic Analysis (BEA), in November 2024 personal income increased $71.1 billion (0.3% at a monthly rate). Disposable personal income (DPI)—personal income less personal current taxes—increased $61.1 billion (0.3%), while personal consumption expenditures (PCE) increased $81.3 billion (0.4%).
Personal outlays—the sum of personal consumption expenditures, personal interest payments and personal current transfer payments—increased $78.2 billion in November. Personal saving was $968.1 billion, while the personal saving rate (personal saving as a percentage of disposable personal income) registered 4.4%.
Important takeaways, courtesy of BEA:
- In November, the $81.3 billion increase in current-dollar PCE reflected an increase of $48.3 billion in spending for goods and an increase of $33 billion in spending for services. Within goods, the largest contributors to the increase were motor vehicles and parts (led by new motor vehicles) and recreational goods and vehicles (led by video, audio, photographic and information-processing equipment and media). Within services, the largest contributing factors were spending for financial services and insurance (led by financial service charges, fees and commissions); recreation services (led membership clubs, sports centers, parks, theaters and museums, as well as gambling); and health care (led by hospitals).
- The PCE price index increased 0.1% in November. Prices for goods increased less than 0.1% and prices for services edged up 0.2%. Food and energy prices increased 0.2%. Excluding food and energy, the PCE price index increased 0.1% month-over-month.
