KPI — January 2023: State of Business

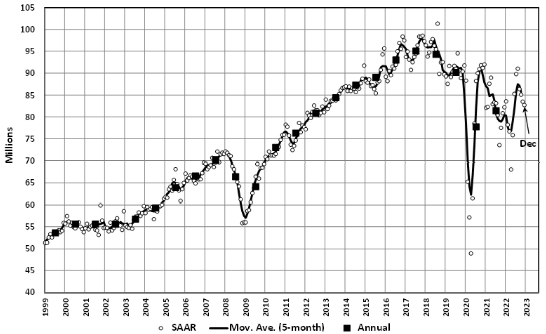
LMC Automotive reports Global Light Vehicle (LV) sales volume declined for the fourth consecutive month – registering 82.7 million units per year in December, despite flat year-over-year raw monthly registrations. In 2022, total sales declined to 81 million units per year.
Data points to a “sluggish” finish for China. Raw sales declined nearly 12% year-over-year, largely due to “increased disruption and uncertainty” associated with an abrupt hault to the zero-COVID policy. Conversely, North America and Europe both posted positive year-over-year growth in December, though both came up short of their 2021 figures (-7% and -11% respectively).
“We expect 2023 to carry a high level of risk and uncertainty as several markets could be dealing with a recession. Nonetheless, we forecast a 6% increase to 85.7 million units. This is up slightly from last month, as the current pullback in China is sooner than initially expected, raising the outlook for next year slightly. There remains a high level of risk related to a weaker global economy and affordability concerns in many markets. Factoring risk could bring the forecast down by as much as two million units to 83.5 million units for the year,” according to Jeff Schuster, president of Americas operations and global vehicle forecasts at LMC Automotive.
State of Manufacturing
The Manufacturing PMI® registered 48.4%, 0.6 percentage point lower than the 49% recorded in November, according to supply executives in the latest Manufacturing ISM® Report On Business®.
“The U.S. manufacturing sector again contracted, with the Manufacturing PMI® at its lowest level since the coronavirus pandemic recovery began. With Business Survey Committee panelists reporting softening new order rates over the previous seven months, the December composite index reading reflects companies’ slowing their output,” says Timothy R. Fiore, CPSM, C.P.M., chair of the Institute for Supply Management® (ISM®) Manufacturing Business Survey Committee.
As such, companies continue to monitor manufacturing conditions and judiciously manage hiring. Panelists’ companies confirm they are continuing to manage head counts through a combination of hiring freezes, employee attrition and now layoffs.
“The month-over-month performance of supplier deliveries was the best since March 2009. Average lead time remained 32% above previous trough for capital expenditures and 37% for purchased materials – both are too high,” he explains. “More attention will be paid to demand as we enter the first quarter to shore up order books for the next six to 12 months.”
Important takeaways, Courtesy of the Manufacturing ISM® Report On Business®:
- Demand eased, with the (1) New Orders Index remaining in contraction territory, (2) New Export Orders Index markedly below 50%, (3) Customers’ Inventories Index in ‘just right’ territory and (4) Backlog of Orders Index recovering slightly but still in strong contraction.
- Output/Consumption (measured by the Production and Employment indexes) was neutral, with a combined zero-percentage point impact on the Manufacturing PMI® calculation.
- The Employment Index moved back into expansion, and the Production Index dropped into contraction territory.
- Inputs – defined as supplier deliveries, inventories, prices and imports – accommodated future demand growth.
- The Supplier Deliveries Index indicated faster deliveries, and the Inventories Index expanded at a faster rate as panelists’ companies continued to effectively manage the total supply chain inventory.
- The Prices Index contracted for the third consecutive month and has declined in each reading since March 2022, when it registered 87.1%.
U.S. New Vehicle Sales
Total new vehicle sales for December 2022, including retail and non-retail transactions, are projected to reach 1,254,700 units – a 5.3% year-over-year increase, according to a joint forecast from J.D. Power and LMC Automotive.
“Retail inventory in December is expected to finish its third consecutive month at more than one million units. With the improving inventory levels, December total sales volume will be up from a year ago; however, there are still not enough vehicles produced to meet demand,” says Thomas King, president of the data and analytics division at J.D. Power.
“While the inventory situation has improved modestly in the fourth quarter, supply remains well below the level at which consumer demand for new vehicles can be met. New vehicle transaction prices continue to rise – albeit at a slower pace than earlier this year,” he adds.
Important Takeaways, Courtesy of J.D. Power:
- Retail buyers are on pace to spend $48.2 billion on new vehicles, down $0.2 billion year-over-year.
- Truck/SUVs are on pace to account for 77.6% of new vehicle retail sales in December.
- The average new vehicle retail transaction price in December is expected to reach $46,382, a 2.5% year-over-year increase. The previous high for any month was $46,171, set in July 2022.
- Average interest rates for new vehicle loans are expected to increase to 6.4%, 247 basis points higher than a year ago.
- Total retailer profit per unit – inclusive of grosses and finance and insurance income – is on pace to be $4,144, down 19.8% from a year ago but still more than double 2019 levels.
- Fleet sales are expected to total 215,500 units in December, up 76% year-over-year on a selling day adjusted basis. Fleet volume is expected to account for 17% of total light-vehicle sales, up from 10% a year ago.
“Looking at 2023, retail sales will continue to be dictated by the number of vehicles shipped to dealerships. Indications are that shipments will rise incrementally throughout the year, allowing sales to increase from 2022 levels,” King says. “However, even with the probability of an economic downturn, pent-up consumer demand from the past two years will keep inventory levels relatively low. Therefore, 2023 is likely to be another year of relative healthy pricing and profitability.”
U.S. Used Market
According to JD Power, used-vehicle prices continue to “decline modestly,” thereby resulting in less trade-in equity for new vehicle buyers. The average trade-in equity in December, for example, was roughly $9,316 – a -3.1% ($297) year-over-year decrease and $786 less in comparison to the peak in June 2022. However, trade equity is still more than double the pre-pandemic level, which helps consumers who have a vehicle to trade offset some of the pricing and interest rate increases.
During the first 15 days of January, wholesale used-vehicle prices (on a mix-, mileage- and seasonally adjusted basis) increased 1.5% since December. The mid-month Manheim Used Vehicle Value Index rose to 222.5, down 13.7% year-over-year. Most of the gains were driven by seasonal adjustment. The non-adjusted price change in the first half of January posted an increase of 0.3% compared to December, while the unadjusted average price was down 12.1% year-over-year.
Data shows Manheim Market Report (MMR) prices “moved in opposite directions” over the last two weeks, though prices stabilized to “typical” levels by mid-January. The first week recorded a higher-than-normal decline of 0.4% in the Three-Year-Old MMR Index. The second week increased 0.3%, leaving prices down 0.1%, which was the average cumulative change in the six years from 2014 through 2019.
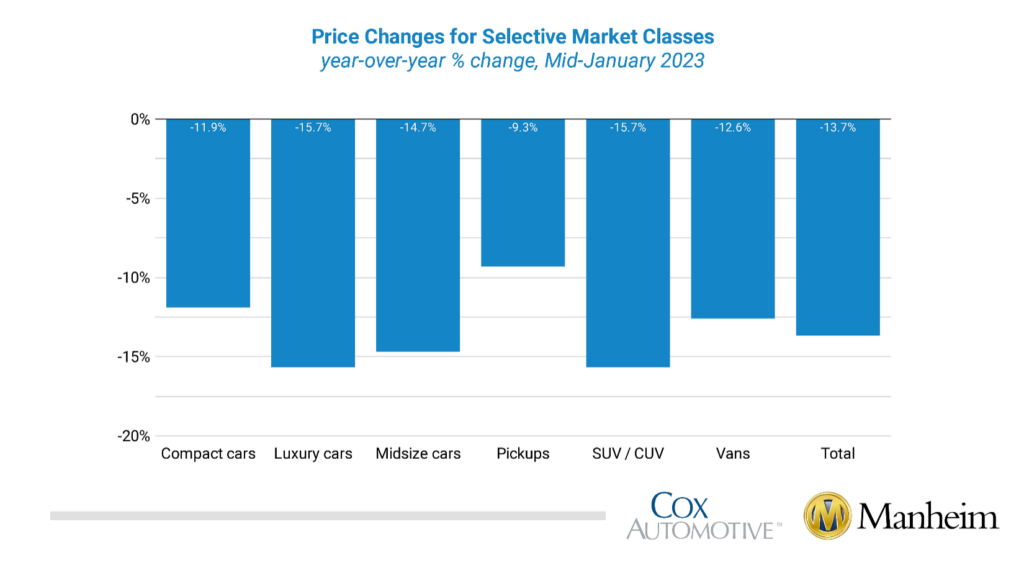
According to Manheim, all eight major market segments posted seasonally adjusted prices that were lower year-over-year in the first half of January. Pickups showed the smallest decline at -9.3%, while compact cars and vans were down 13.7% in seasonally adjusted year-over-year changes. Four of eight major segments experienced price increases compared to December, with gains from 0.7% to 2.8%. The remaining segments saw declines of between 0.2% and 1.4%.
KPI — January 2023: Recent Vehicle Recalls
Key Performance Indicators Report — January 2023