KPI — January 2023: Consumer Trends

Below is a synopsis of consumer confidence, sentiment and spending trends.
The Conference Board Consumer Confidence Index® climbed in December following back-to-back monthly declines. The Index now stands at 108.3 (1985=100), up notably from 101.4 in November. The Present Situation Index – based on consumers’ assessment of current business and labor market conditions – increased from 138.3 to 147.2. The Expectations Index – based on consumers’ short-term outlook for income, business and labor market conditions – improved from 76.7 to 82.4. Conversely, Expectations continue to linger around 80, a level associated with recession.
“Consumer confidence bounced back in December, reversing consecutive declines in October and November to reach its highest level since April 2022,” says Lynn Franco, senior director of economic indicators at The Conference Board. “The Present Situation and Expectations Indexes improved due to consumers’ more favorable view regarding the economy and jobs. Inflation expectations retreated in December to their lowest level since September 2021, with recent declines in gas prices a major impetus.”
According to recent data, vacation intentions improved but plans to purchase homes and big-ticket appliances cooled further. Franco says the shift in consumers’ preference from big-ticket items to services will continue in 2023, as will headwinds from inflation and interest rate hikes.
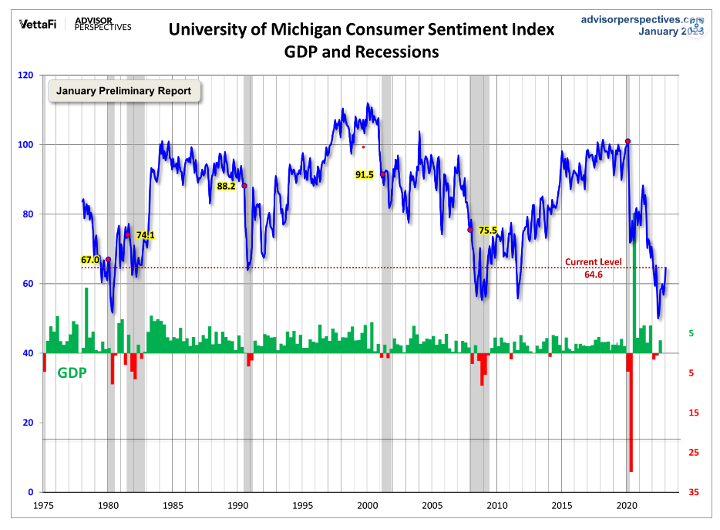
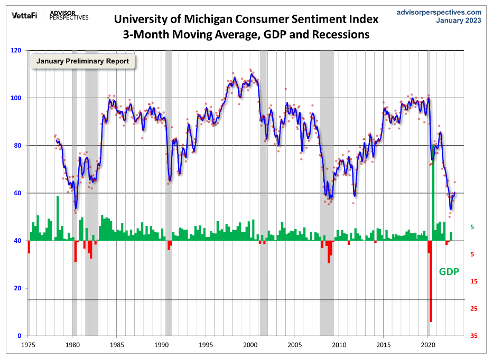
The chart evaluates the historical context for this index as a coincident indicator of the economy. Toward this end, Advisor Perspectives highlighted recessions and included GDP. To put the current report into larger historical context since its beginning in 1978, consumer sentiment is 24% below its average reading (arithmetic mean) and 23% below its geometric mean. The current index level is at the 8th percentile of the 541 monthly data points in this series. The indicator is somewhat volatile, with a 3.1-point absolute average monthly change. The latest data point showed a 4.9-point increase from the previous month.
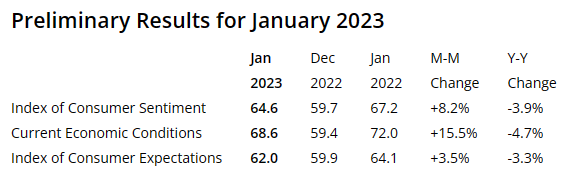
The Consumer Sentiment Index January Preliminary Report is currently 64.6, up 4.9 (8.2%) from the December final, according to the University of Michigan Survey of Consumers.
Important Takeaways, Courtesy of Survey of Consumers:
- Current assessments of personal finances surged 16% to its highest reading in eight months (on the basis of higher incomes and easing inflation).
- Although the short-run economic outlook decreased modestly from December, the long-run outlook rose 7% to its highest level in nine months. It is now 17% below its historical average.
- Year-ahead inflation expectations receded for the fourth straight month, falling from 4.4% in December to 4% in January. The current reading is the lowest since April 2021 but remains well above the 2.3-3% range common in the two years prior to the pandemic.
“Uncertainty over both inflation expectations measures remains high, and changes in global factors in the months ahead may generate a reversal in recent improvements,” says Joanne Hsu, director at Survey of Consumers.
Consumer Income & Spending
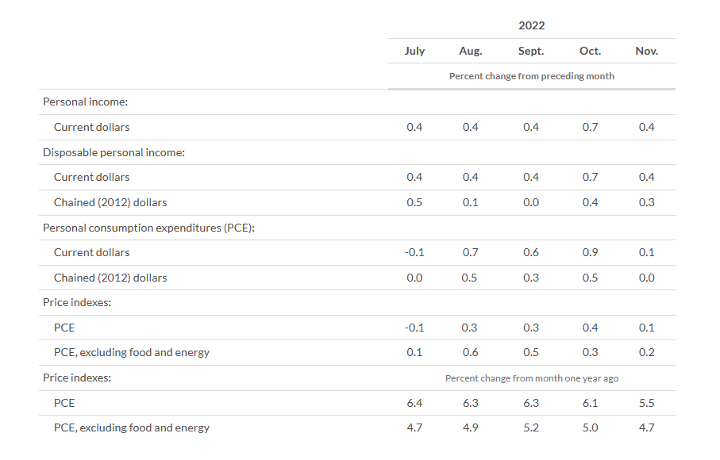
According to the U.S. Bureau of Economic Analysis (BEA), in November 2022 personal income increased $80.1 billion (0.4%), disposable personal income (DPI) increased $68.6 billion (0.4%) and personal consumption expenditures (PCE) increased $19.8 billion (0.1%).
In addition, personal outlays edged up $26.6 billion. Personal saving registered $461.2 billion and the personal saving rate – personal saving as a percentage of disposable personal income – was 2.4%.
Important Takeaways, Courtesy of BEA:
- The $19.8 billion increase in current-dollar PCE during November reflected an increase of $79.2 billion in spending for services, which was partly offset by a $59.5 billion decrease in spending for goods. Housing was the single largest contributing factor to the increase in services, while spending on new motor vehicles (mainly new light trucks) impacted the decrease in goods.
- The PCE price index increased 0.1% in November. Excluding food and energy, the PCE price index increased 0.2%. Real DPI increased 0.3%, while real PCE increased less than 0.1%. Goods decreased 0.6% and services increased 0.3 percent%.
- The PCE price index increased 5.5% year-over-year. Prices for goods increased 6.1%, while prices for services increased 5.2%. Food prices jumped 11.2% and energy prices 13.6%. Excluding food and energy, the PCE price index increased 4.7% year-over-year in November 2022.
Key Performance Indicators Report — J


