
- KPI – February 2025: The Brief
- KPI – February 2025: Recent Vehicle Recalls
- KPI – February 2025: State of Business – Automotive Industry
- KPI – February 2025: State of Manufacturing
- KPI – February 2025: Consumer Trends
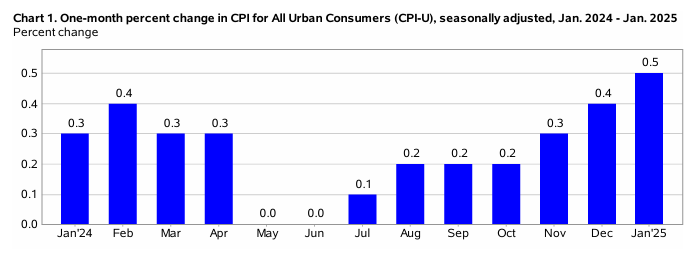
In January 2025, the Consumer Price Index for All Urban Consumers (CPI-U) increased 0.5% on a seasonally adjusted basis after rising 0.4% in December 2024, according to the U.S. Bureau of Labor Statistics. Over the last 12 months, the all-items index increased 3% before seasonal adjustment.
Important takeaways, courtesy of the U.S. Bureau of Labor Statistics:
- The index for shelter edged up 0.4%, accounting for nearly 30% of the monthly all-items increase. The energy index rose 1.1% month-over-month, with the gasoline index jumping 1.8%. The index for food also increased 0.4%, as the index for food-at-home rose 0.5% and the index for food-away-from-home increased 0.2%.
- Indexes on the rise include motor vehicle insurance, recreation, used cars and trucks, medical care, communication and airline fares. The indexes for apparel, and personal care, as well as household furnishings and operations were among the few major indexes to decrease.
The all-items index rose 3% year over year in January 2025, following a 2.9% year over year increase in December 2024. The all-items-less-food-and-energy index rose 3.3% year over year. The energy index increased 1%, while the food index rose 2.5%.
EMPLOYMENT
Total nonfarm payroll employment rose by 143,000 in January 2025 – down from an upwardly revised 261,000 in November 2024 and 307,000 in December 2024, as well as slightly below the Dow Jones monthly forecast of 169,000. Job growth was concentrated in health care (44,000), retail (34,000) and government (32,000). The unemployment rate and number of unemployed persons edged down to 4% and 6.8 million, respectively.
According to the U.S. Bureau of Labor Statistics, the labor force participation and long-term unemployed (those jobless for 27 weeks or more) rates improved slightly at 62.6% and 21.1%, respectively. In addition, categories like discouraged workers and those holding part-time jobs for economic reasons were relatively unchanged month over month but remain elevated – the latter of which is up from 4 million to 4.5 million persons year over year.
Wage growth posted stronger results than expected, with average earnings up 0.5% compared to last month and 4.1% year over year. Both statistics top LSEG economists’ estimates of 0.3% growth on a monthly basis and 3.8% year over year.
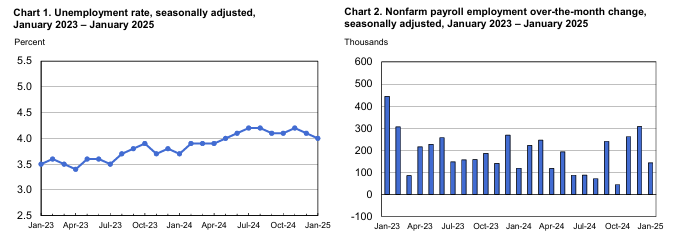
Caption: CNBC notes the report featured “significant benchmark revisions” to the 2024 totals, including substantial downward changes to the previous payrolls level and upward revisions to those who reported holding jobs. The annual revisions reduced the jobs count by 589,000 in the 12 months through March 2024. A preliminary adjustment back in August 2024 indicated 818,000 fewer jobs.
“A lower-than-expected January payrolls number was more than offset by upward revisions to November and December’s totals and a downtick in the unemployment rate,” says Ellen Zentner, chief economic strategist at Morgan Stanley Wealth Management. “Those who’d hoped for a soft report that would nudge the Fed back into rate-cutting mode didn’t get it.”
BY DEMOGRAPHIC
This month’s unemployment rates among the major worker groups: adult women – 3.7%; adult men – 3.7%; teenagers – 11.8%; Asians – 3.7%; Whites – 3.5%; Hispanics – 4.8%; and Blacks – 6.2%.
Last month’s unemployment rates among the major worker groups: adult women – 3.8%; adult men – 3.7%; teenagers – 12.4%; Asians – 3.5%; Whites – 3.6%; Hispanics – 5.1%; and Blacks – 6.1%.
 Source: U.S. Bureau of Labor Statistics data
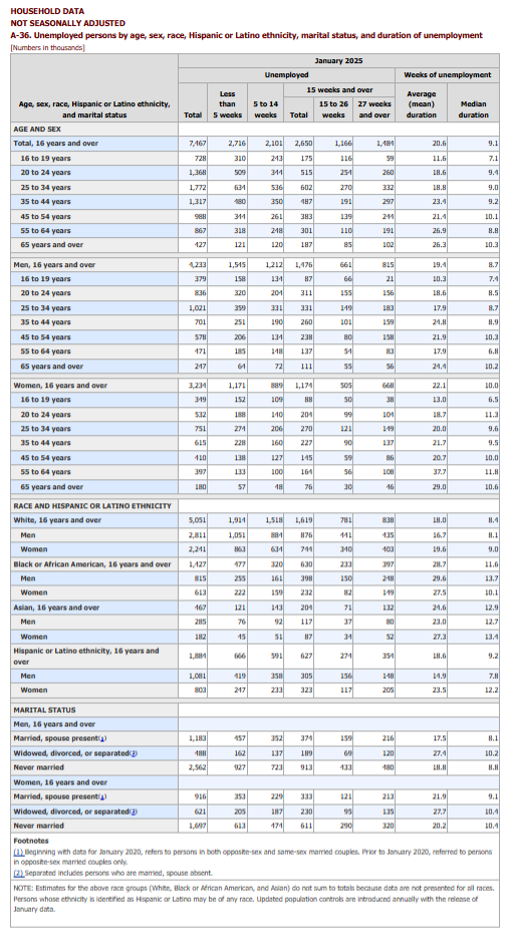
Image Source: A-36. Unemployed persons by age, sex, race, Hispanic or Latino ethnicity, marital status, and duration of unemployment (bls.gov).
BY INDUSTRY
The Conference Board Employment Trends Index (ETI) declined from a downwardly revised 109.23 in December 2024 to 108.35 in January 2025.
“The index has largely moved sideways since late summer, consistent with a range of indicators that suggest the trend of normalization is slowing but that the labor market remains resilient,” says Mitchell Barnes, economist at The Conference Board.
Data shows the share of consumers who report “jobs are hard to get” – an ETI component from the Consumer Confidence Survey – rose from 14.9% in December 2024 to 16.8% in January 2025. While it is the first increase in four months, the data is consistent with August 2024 levels.
In addition, the share of small firms that report jobs are “not able to be filled right now” was flat in January and remains stable since September 2024. Similarly, data shows job openings are at a consistent level since mid-2024, despite several large monthly swings. Barnes says measures of the economic activity in Real Manufacturing and Trade Sales and Industrial Production each contributed negatively to January’s Index, despite positive contributions over the second half of 2024.
“While the labor market has cooled from its 2022 pace, metrics through January are broadly in line with the pre-pandemic labor market,” he says, noting initial claims for unemployment insurance in January (216,800) registered below the 2019 average, following a decline of 10% after a recent peak in June 2024.
In a stable January Employment Report, Barnes says the share of involuntary part-time workers “ticked up slightly” after contributing positively to the ETI since September. Employment in the temporary-help industry declined in January, yet final revisions show the 5,000 workers gained since November is the strongest three-month stretch dating back to February 2022.
“Overall, January data reaffirms that the labor market remains stable,” Barnes explains. “High employment levels, sustained real wage growth and steady labor demand continue to support economic momentum.”
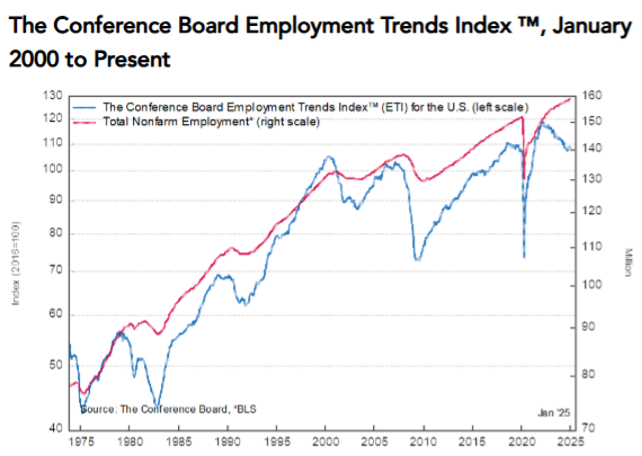
Caption: The Employment Trends Index is a leading composite index for payroll employment. When the index increases, employment is likely to grow as well, and vice versa. Turning points in the index indicate that a change in the trend of job gains or losses is about to occur in the coming months.
Important takeaways, courtesy of the U.S. Bureau of Labor Statistics:
- Health care added 44,000 jobs, with gains in hospitals (+14,000), nursing and residential care facilities (+13,000), as well as home health care services (+11,000).
- Employment in retail trade increased by 34,000, with gains in general merchandise retailers (+31,000) and furniture and home furnishings retailers (+5,000). Electronics and appliance retailers lost 7,000 jobs.
- Social assistance added 22,000 jobs, led by individual and family services (+20,000). Employment also rose in the community food and housing, as well as emergency and other relief services industry (+4,000).
- Government employment continued to trend up (+32,000).
- Employment in the mining, quarrying and oil and gas extraction industry declined by 8,000. Job loss was concentrated in support activities for mining (-8,000).
Click here to review more employment details.


