KPI — February 2023: State of Business
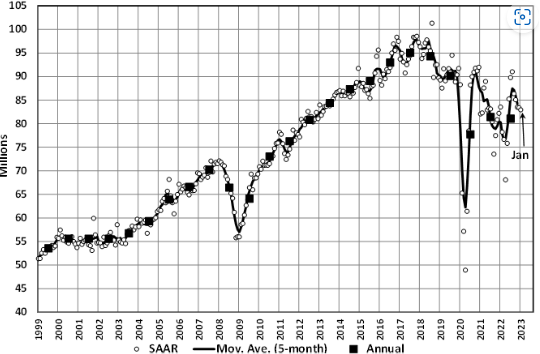
LMC Automotive reports Global Light Vehicle (LV) sales volume increased slightly from 82.7 million units per year in December 2022 to 83 million units per year in January 2023. Global supply constraints and “distortions from tax changes” impacted the monthly figures. In addition, monthly registrations were down 8% year-over-year. The Chinese market is off to a slow start this year, with raw sales plunging 33% year-over-year. Both North America and Western Europe posted year-over-year growth in January, while Eastern Europe is down.
The past year presented the automotive industry with numerous uphill challenges that negatively impacted recovery, notes Jeff Schuster, president of global forecasts at LMC Automotive.
“December’s slightly better results did push 2022 to 81.1 million units, a decline of 0.4% from 2021. With disruption and economic uncertainty expected to remain as headwinds in 2023, the outlook continues to hold an elevated level of risk. The forecast for 2023 is at 85.8 million units, an increase of 6% from 2022’s contraction. We expect more downside risk to the forecast, as affordability is a concern with many new-vehicle buyers. This risk could erode up to two million units of the expected recovery, cutting the growth to 3% for the year,” Schuster says. “That said, we continue to believe there is a level of unfulfilled demand that exceeds the level of production and inventory, so a path to a more pronounced recovery exists, but it may be pushed to 2024 or even 2025.”
State of Manufacturing
Economic activity in the manufacturing sector contracted in January for the third consecutive month following a 28-month period of growth, according to the nation’s supply executives in the latest Manufacturing ISM® Report On Business®. The Manufacturing PMI® registered 47.4%, one percentage point lower than the seasonally adjusted 48.4% recorded in December.
“The U.S. manufacturing sector again contracted, with the Manufacturing PMI® at its lowest level since the coronavirus pandemic recovery began. With Business Survey Committee panelists reporting softening new order rates over the previous nine months, the January composite index reading reflects companies slowing outputs to better match demand in the first half of 2023 and prepare for growth in the second half of the year,” says Timothy R. Fiore, CPSM, C.P.M., chair of the Institute for Supply Management® (ISM®) Manufacturing Business Survey Committee.
Important takeaways, Courtesy of the Manufacturing ISM® Report On Business®:
- Demand eased, with the (1) New Orders Index contracting strongly, (2) New Export Orders Index still below 50% but improving, (3) Customers’ Inventories Index contracting slightly (a positive for future production) and (4) Backlog of Orders Index recovering for a second month but still in strong contraction.
- Output/Consumption (measured by the Production and Employment indexes) was negative, with a combined 0.8-percentage point downward impact on the Manufacturing PMI® calculation.
- The Employment Index remained slightly above 50% and the Production Index logged a second month in contraction territory. Panelists’ companies are indicating that they are not going to substantially reduce head counts as they are positive about the second half of the year.
- Inputs – defined as supplier deliveries, inventories, prices and imports – continue to accommodate future demand growth.
- The Supplier Deliveries Index indicated faster deliveries, while the Inventories Index expanded at a slower rate as panelists’ companies manage the total supply chain inventory.
- The Prices Index contracted for the fourth consecutive month but at a slower rate.
U.S. New Vehicle Sales
Total new vehicle sales for January 2023, including retail and non-retail transactions, are projected to reach 1,043,100 units – a 5.4% year-over-year incresase, according to a joint forecast from J.D. Power and LMC Automotive.
“As we start 2023, supply chain disruptions continue but are becoming less severe. This is leading to an increase in the number of vehicles being delivered to dealerships and fleet customers,” says Thomas King, president of the data and analytics division at J.D. Power.
“While retail inventory levels are generally rising, several manufacturers are directing a larger portion of their increased production towards fleet customers. Fleet sales have been more heavily inventory constrained than retail sales during the past several years, resulting in significant pent-up demand. Rising production levels now allow manufacturers to better support their fleet customers while maintaining retail inventory levels,” he adds.
Important Takeaways, Courtesy of J.D. Power:
- Retail buyers are on pace to spend $39.9 billion on new vehicles – up $0.9 billion year-over-year.
- Truck/SUVs are on pace to account for 78.7% of new vehicle retail sales in January.
- The average new vehicle retail transaction price is expected to reach $46,437, a 4.2% year-over-year increase.
- Average interest rates for new vehicle loans are expected to hit 6.79%, up 264 basis points compared to a year ago.
- Total retailer profit per unit – inclusive of grosses and finance plus insurance income – is on pace to be $3,975, down 22% year-over-year but still more than double 2019 levels.
- Fleet sales are expected to total 183,300 units in January, up 59.4% year-over-year on a selling day adjusted basis. Fleet volume is expected to account for 18% of total light-vehicle sales, up from 12% a year ago.
“This year is off to an encouraging start from an inventory and sales standpoint. Retailer profitability is softening as expected but remains well above historical norms,” King says. “Looking forward to February, the industry sales pace will continue to be inventory constrained despite improving production levels. Each manufacturer is emerging from the supply shortage in a slightly different way, with variation in production recovery, retail vs. fleet focus and pricing strategy. This means February will likely be similar to January at the industry level, but with rising variation in manufacturer performance.”
U.S. Used Market
According to JD Power, used-vehicle prices are declining. This is resulting in less trade-in equity for new vehicle buyers. Currently, the average trade-in equity is around $9,350, which is down $255 (-2.7%) from a year ago and $709 since the peak in June 2022. For context, JD Power notes January 2023 trade equity remains more than double the pre-pandemic level, thus helping owners with a vehicle to trade in offset some of the pricing and interest rate hikes.
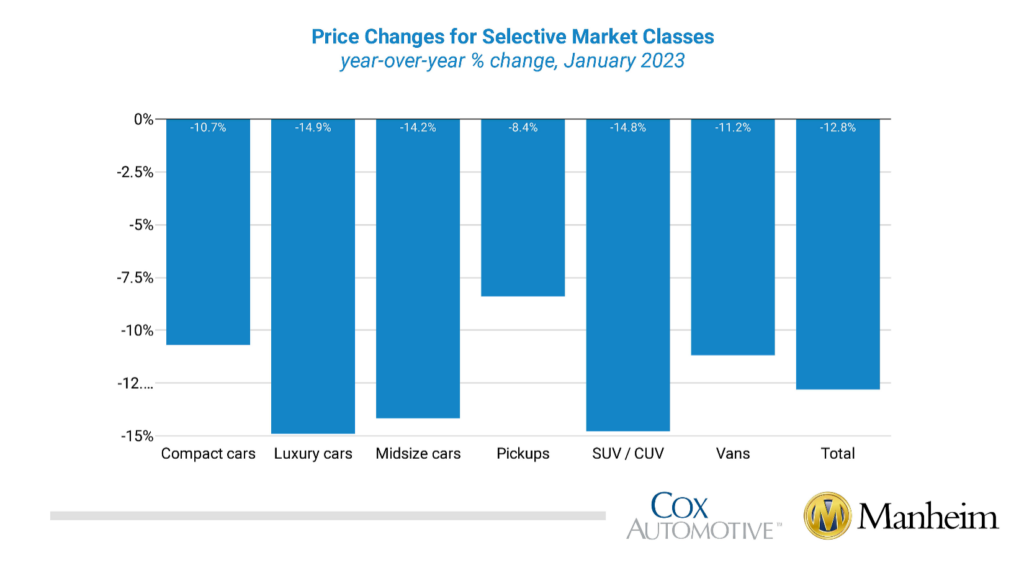
Wholesale used-vehicle prices (on a mix, mileage and seasonally adjusted basis) increased 2.5% in January. The Manheim Used Vehicle Value Index (MUVVI) climbed to 224.8, down 12.8% from a year ago.
Data shows Manheim Market Report (MMR) values posted price increases that were not typical, culminating in a 1.2% total increase in the Three-Year-Old Index over the last four weeks.
According to Manheim, all eight major market segments continued to see seasonally adjusted prices that were lower year-over-year in January. Pickups showed the smallest decrease at 8.4%, followed by compact cars (-10.7%) and vans (-11.2%). However, the other five segments’ prices were lower than the industry. Compared to December, six of the eight major segments’ performances were up between 0.8% and 3.6%, with pickups as the frontrunner. Only full-size and luxury cars were down month-over-month.
KPI — February 2023: Recent Vehicle Recalls
Key Performance Indicators Report — February 2023


