KPI — February 2022: Consumer Trends

The Conference Board Consumer Confidence Index® declined in January, following an increase in December. The Index now stands at 113.8 (1985=100), down from 115.2 in December. The Present Situation Index – based on consumers’ assessment of current business and labor market conditions – improved to 148.2 from 144.8 last month. The Expectations Index – based on consumers’ short-term outlook for income, business and labor market conditions – declined to 90.8 from 95.4.
“Consumer confidence moderated in January, following gains in the final three months of 2021,” said Lynn Franco, senior director of economic indicators at The Conference Board. “The Present Situation Index improved, suggesting the economy entered the new year on solid footing. However, expectations about short-term growth prospects weakened, pointing to a likely moderation in growth during the first quarter of 2022,” she continued.
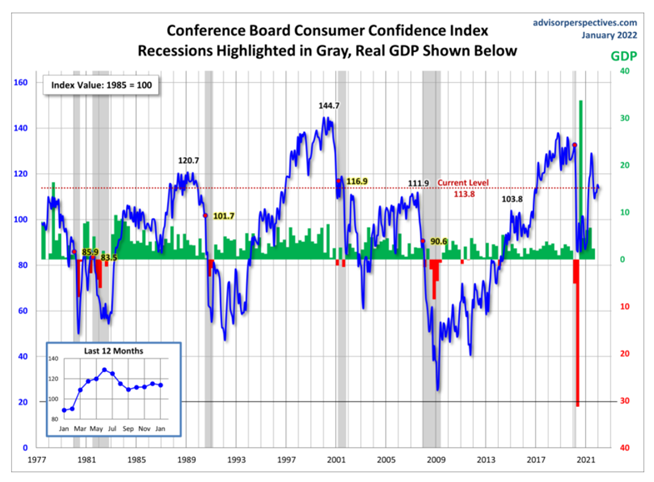
Jill Mislinski of Advisor Perspectives — a leading interactive publisher for Registered Investment Advisors (RIAs), wealth managers and financial advisors — put the recent consumer sentiment report into larger historical context as a coincident indicator of the economy. “Toward this end, we have highlighted recessions and included GDP. The regression through the index data shows the long-term trend and highlights the extreme volatility of this indicator. Statisticians may assign little significance to a regression through this sort of data, but the slope resembles the regression trend for real GDP shown below, and it is a more revealing gauge of relative confidence than the 1985 level of 100 that the Conference Board cites as a point of reference,” she said.
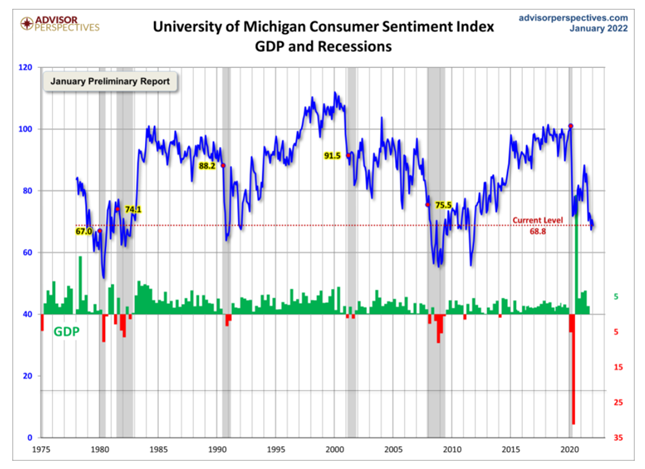
Similarly, The Consumer Sentiment Index – a survey consisting of approximately 50 core questions covering consumers’ assessments of their personal financial situation, buying attitudes and overall economic conditions – fell to 67.2 in January. COVID-19, supply chain pressures, rising inflation, falling real incomes and “the extraordinary pace” of rising home and stock prices, which are likely to turn negative in the year ahead, were all cited as contributing factors, according to the University of Michigan Survey of Consumers. Overall confidence in government economic policies is at its lowest level since 2014.
“Although their primary concern is rising inflation and falling real incomes, consumers may misinterpret the Fed’s policy moves to slow the economy as part of the problem rather than part of the solution. The danger is that consumers may overreact to these tiny nudges, especially given the uncertainties about the coronavirus and other heightened geopolitical risks. Clear policy communication is insufficient if it does not also advance consumers’ understanding of the economic tradeoffs involved and their plans to actively alleviate any undue harm,” says Richard Curtin, Surveys of Consumers chief economist.
Looking ahead, both confidence and consumer spending may continue to be challenged by rising prices and the ongoing pandemic, adds Franco.
Consumer Income & Spending
According to the U.S. Bureau of Economic Analysis (BEA), Personal income increased $70.7 billion (.3%) in December. Disposable personal income (DPI) increased $39.9 billion (.2%) and personal consumption expenditures (PCE) decreased $95.2 billion (.6%).
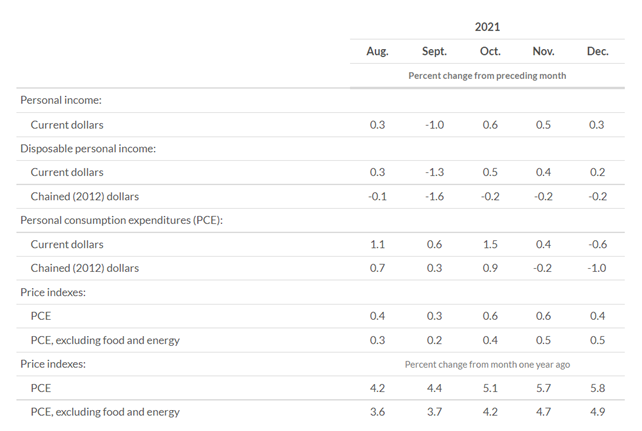
The increase in personal income in December primarily reflected an increase in compensation that was partly offset by a decrease in proprietors’ income, explained BAE. Within compensation, the increase reflected increases in both private and government wages and salaries. Within proprietors’ income, both nonfarm and farm income decreased. Government social benefits decreased slightly, reflecting the winding down of pandemic-related assistance programs.
Important Takeaways, Courtesy of BEA
- The $95.2 billion decrease in current-dollar PCE in December reflected a decrease of $147.2 billion in spending for goods that was partly offset by a $52.0 billion increase in spending for services. Within goods, decreases were widespread across most components and were led by recreational goods and vehicles, “other” nondurable goods (which includes newspapers, household supplies, games and toys), as well as furnishings and durable household equipment. Within services, the largest contributor to the increase was spending for health care.
- Personal outlays decreased $93.5 billion in December. Personal saving was $1.44 trillion in December and the personal saving rate – personal saving as a percentage of disposable personal income – was 7.9%.
- The PCE price index for December increased 5.8% from one year ago, reflecting increases in both goods and services. Energy prices increased 29.9%, while food prices increased 5.7%. Excluding food and energy, the PCE price index for December increased 4.9% from one year ago.
Image Source: Personal Income and Outlays, December 2021 | U.S. Bureau of Economic Analysis (BEA)
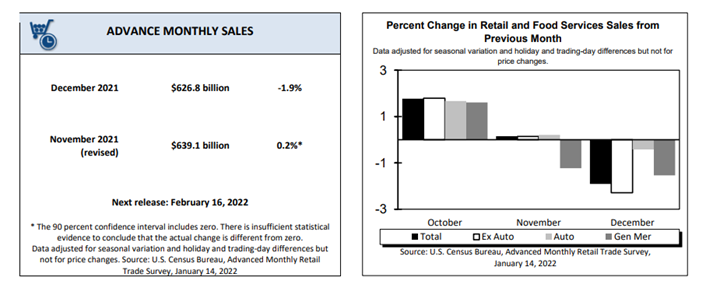
According to the U.S. Census Bureau, advance estimates of U.S. retail and food services sales for December 2021 – adjusted for seasonal variation and holiday and trading-day differences, but not for price changes – were $626.8 billion. It is a decrease of 1.9% (±.5%) from the previous month but up 16.9% (±.9%) year-over-year. Total sales for the 12 months of 2021 increased 19.3% (±.5%) compared to 2020. Total sales for the October 2021 through December 2021 period rose 17.1% (±.7%) year-over-year. The October 2021 to November 2021 percent change was revised from up .3% (±.5%)* to up .2% (±.3%)*. Retail trade sales were down 2.1% (±.4%) from November 2021 but up 14.4% (±.7%) year-over-year. Gasoline stations increased 41% (±1.6%) from December 2020, while food services and drinking places were up 41.3% (±4%) from last year.
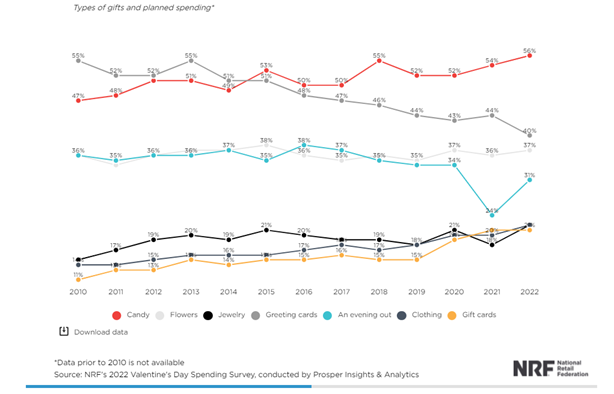
While inflation may be red hot, Valentine’s Day spending is expected to reach $23.9 billion this year – up from $21.8 billion in 2021 and the second-highest year on record, according to the annual survey released today by the National Retail Federation and Prosper Insights & Analytics.
The survey shows more than half (53%) of U.S. consumers plan to celebrate the holiday in 2022, up from 52% last year. Three-quarters (76%) of those celebrating say it is important to do so given the current state of the pandemic. Moreover, shoppers expect to spend an average of $175.41 per person on Valentine’s Day gifts, up from $164.76 in 2021.
Key Performance Indicators Report — February 2022


