KPI — February 2021: State of the Economy

The Conference Board revised its real GDP projection, expecting a 3.5%* (annualized rate) increase during 4Q20 and 2%** in 1Q21. The economy has rebounded partially from a deep contraction in the first half of 2020 due to the pandemic, but a variety of factors will determine how the recovery unfolds in 2021, explained The Conference Board. Key variables include:
- Scale of the ongoing COVID-19 resurgence and any resulting lockdowns
- Deployment and effectiveness of COVID-19 vaccines
- Size and timing of fiscal stimulus
- Status of labor markets and household consumption
- Degree to which volatility in the U.S. political transition affects consumer and business confidence
Indeed, there are many possible outcomes. However, The Conference Board has generated three potential recovery scenarios based on specific sets of assumptions.
All data and analysis are courtesy of The Conference Board.
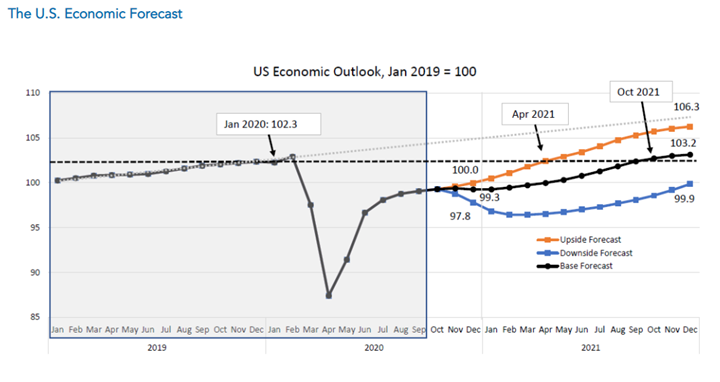
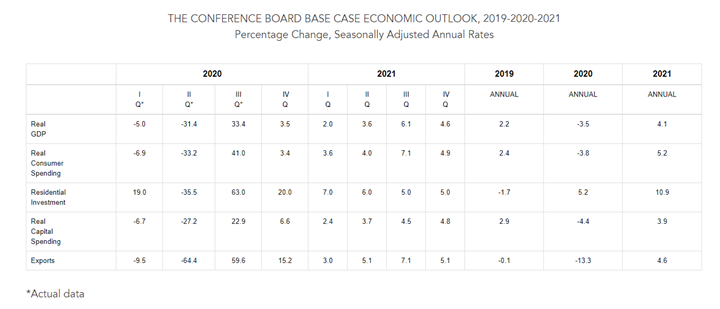
- Base Forecast: The base case forecast results in real GDP growth of 2%* (annualized rate) during 1Q21 and an annual expansion of 4.1%, following an annual contraction of 3.5% in 2020. This scenario is noted as the most probable: a) new cases of COVID-19 peak in early 1Q21 but no widespread lockdowns are implemented, b) vaccines are deployed gradually in 1Q21 but volumes accelerate into 2Q21, c) the December 2020 stimulus package is fully deployed in 1Q21 and an additional stimulus package is deployed in 2Q21, d) labor markets and consumption weaken slightly in 1Q21 but rebound in 2Q21 and 3Q21 and e) the political transition does not result in a hit to consumer or business confidence. Such assumptions yield a lull in the recovery during 4Q20 and early 1Q21, but a steady acceleration of economic activity that should peak in the summer months as consumers eagerly spend on services and goods they sacrificed in 2020. In this scenario, U.S. monthly economic output returns to pre-pandemic levels in August 2021.
- Upside Forecast: A second, more optimistic scenario shows the economy growing 6.4% in 2021, following an annual contraction of 3.5% in 2020. This scenario assumes: a) new COVID-19 cases fall dramatically in late 1Q21 and social distancing policies loosen, b) vaccines are deployed rapidly in 1Q21 and universally available in early 2Q21, c) the December 2020 stimulus package is fully deployed in early 1Q21 and an additional stimulus package is rolled out in late 1Q21/early 2Q21, d) a strong rebound in consumption and employment in 1Q21 and e) the political transition does not result in a hit to consumer or business confidence. In this scenario, U.S. monthly economic output returns to pre-pandemic levels in April 2021.
- Downside Forecast: A third, more pessimistic scenario shows the U.S. economy contracting during 1Q21 before stabilizing over the summer—resulting in an annual growth rate of .8% in 2021. It assumes a) a large spike in COVID-19 cases in 1Q21 that result in widespread lockdowns, b) a lengthy vaccines distribution period and/or vaccine ineffectiveness against new COVID-19 strains, c) no additional fiscal stimulus in 2021, d) a deterioration in unemployment and consumption in the first half of 2021 and e) a very volatile political transition that disrupts business and consumer confidence. In this scenario, U.S. monthly economic output does not recover to pre-pandemic levels until some time in 2022.
* The Conference Board is adjusting its forecast of 4Q20 real GDP growth from 2.8% (annualized rate) to 3.5% (annualized rate). This upgrade is due to stronger than expected economic indicators in November and December.
** The Conference Board is adjusting its forecast of 1Q21 real GDP growth from .7% (annualized rate) to 2% (annualized rate). This upgrade is in relation to the second round of stimulus that was passed in December, continued progress in the deployment of multiple COVID-19 vaccines and a stronger than expected growth hand-off from 4Q20.
Employment
Total nonfarm payroll employment declined by 140,000 in December after increasing 245,000 in November. The unemployment rate remains unchanged from a month prior—6.7%, or approximately 10.7 million people.
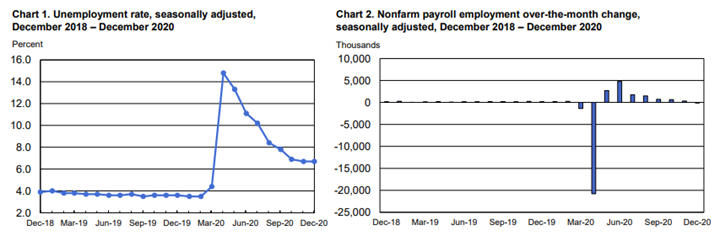
“The decline in payroll employment reflects the recent increase in coronavirus (COVID-19) cases and efforts to contain the pandemic,” explained the U.S. Bureau of Labor Statistics. Other takeaways, courtesy of the Bureau’s recent reporting:
- Among the unemployed, the number of persons on temporary layoff increased by 277,000 to three million. This measure is down considerably from the high of 18 million in April but is 2.3 million higher compared to February.
- The number of permanent job losers declined by 348,000 to 3.4 million but is up by 2.1 million since February.
- The number of long-term unemployed (those jobless for 27 weeks or more) remains essentially unchanged month-over-month at four million but has increased by 2.8 million compared to February. The number of those jobless for 27 weeks or more accounted for 37.1% of total unemployed in December.
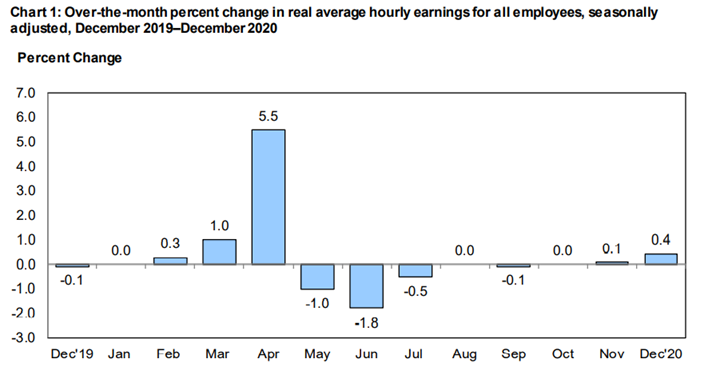
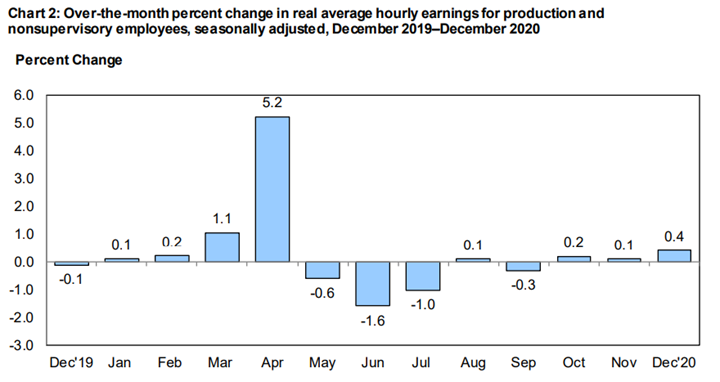
Additionally, real average hourly earnings for all employees increased .4% from November to December (seasonally adjusted), “which stems from an increase of .8% in average hourly earnings combined with an increase of .4% in the Consumer Price Index for All Urban Consumers (CPI-U),” according to the U.S. Bureau of Labor Statistics.
By Demographic
Unemployment rates among all major worker groups in December: adult women—6.3%, adult men—6.4%, teenagers—16%, Asians—5.9%, Whites—6%, Hispanics—9.3% and Blacks—9.9%.
For comparison, unemployment rates among all major worker groups in November: adult women – 6.1%, adult men – 6.7%, teenagers – 14%, Whites – 5.9%, Asians – 6.7%, Hispanics – 8.4% and Blacks – 10.3%.
For comparison, unemployment rates among all major worker groups in October: adult women—6.5%, adult men—6.7%, teenagers—13.9%, Whites—6%, Asians—7.6%, Hispanics—8.8% and Blacks—10.8%.
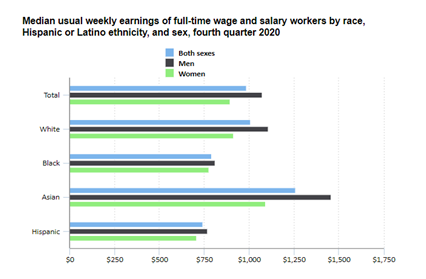
Median weekly earnings of the nation’s 111.5 million full-time wage and salary workers were $984 in the fourth quarter of 2020. Median weekly earnings for women were $894, or 83.4% of the median of $1,072 for men.
By Industry
In December, total nonfarm payroll employment declined by 140,000—following an increase of 245,000 a month prior.
Employment declines in leisure and hospitality, private education and government were partially offset by gains in professional and business services, retail trade, construction, as well as transportation and warehousing, according to the U.S. Bureau of Labor Statistics.
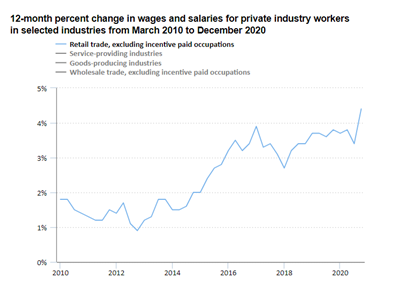
Wages and salaries for private retail trade workers, excluding incentive paid occupations, increased 4.4% for the year ended in December 2020, according to the U.S. Bureau of Labor Statistics. This was higher than the 2.8% increase in wages and salaries for all private industry workers. Read more.
Important employment takeaways, courtesy of the U.S. Bureau of Labor Statistics:
- Construction added 51,000 jobs, but employment remains 226,000 below its February level. Employment jumped in residential specialty trade contractors (+14,000) and residential building (+9,000). Employment also increased in non-residential specialty trade contractors (+18,000) and in heavy and civil engineering construction (+15,000).
- Manufacturing employment increased by 38,000, with gains in motor vehicles and parts (+7,000), plastics and rubber products (+7,000), as well as non-metallic mineral products (+6,000). By contrast, miscellaneous non-durable goods manufacturing lost 11,000 jobs over the month. Despite gains during the past eight months, employment in manufacturing is 543,000 below its February level.
- Wholesale trade employment rose by 25,000 but is down by 251,000 since February. Job gains occurred in durable goods (+11,000) and non-durable goods (+11,000).
- Employment in transportation and warehousing increased by 47,000, largely in couriers andmessengers (+37,000). While employment in transportation and warehousing is 89,000 lower compared to February, employment in couriers and messengers has increased by 222,000 during the same period. Employment also grew in warehousing and storage (+8,000) and in truck transportation (+7,000), while transit and ground passenger transportation lost 9,000 jobs.
- Retail trade added 121,000 jobs, with nearly half of the growth occurring in general merchandise stores. Job gains also occurred in non-store retailers (+14,000), automobile dealers (+13,000), health and personal care stores (+10,000), as well as food and beverage stores (+8,000). Employment in retail trade is 411,000 lower compared to February.
- Leisure and hospitality declined by 498,000, with three-quarters of the decrease in food services and drinking places (-372,000). Since February, employment in leisure and hospitality is down by 3.9 million, or 23.2%.
- Professional and business services increased by 161,000, with a large gain in temporary help services (+68,000). Job growth also occurred in computer systems design and related services (+20,000), other professional and technical services (+11,000), management of companies and enterprises (+11,000), as well as business support services (+7,000). Employment in professional and business services is down by 858,000 since February.
- Health care added 39,000 jobs; employment growth in hospitals (+32,000) and ambulatory health care services (+21,000) was partially offset by declines in nursing care facilities (-6,000) and community care facilities for the elderly (-5,000). Health care employment is 502,000 lower compared to February.
Click here for more detailed information by industry.
By Geography
In December, unemployment rates were lower in 19 states, higher in 12 states (+District of Columbia) and stable in 19 states, according to the U.S. Bureau of Labor Statistics.
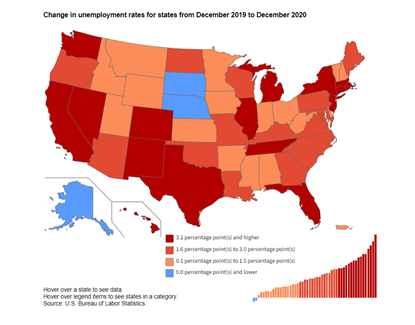
Additionally, 45 states and the District reported jobless rate increases from a year earlier, one state had a decrease and four states had little or no change, per the report.
Furthermore, nonfarm payroll employment increased in 15 states, decreased in 11 states and was essentially unchanged in 24 states (+District of Columbia). Over the year, nonfarm payroll employment decreased in 48 states (+District of Columbia) and was essentially unchanged in two states.
Hawaii and Nevada posted the highest unemployment rates at 9.3% and 9.2% respectively. Meanwhile, Nebraska and South Dakota reported the lowest rates at 3% percent each. In total, 25 states showed jobless rates lower than the U.S. figure of 6.7%, 10 states (+District of Columbia) had higher rates and 15 states reported rates that were not appreciably different from that of the nation.
To review the full report details, click here.


