KPI — February 2021: Consumer Trends

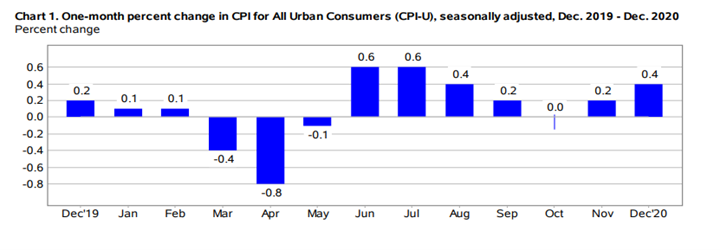
The Consumer Price Index for All Urban Consumers (CPI-U) increased .4% in December on a seasonally adjusted basis after rising .2% a month prior, according to the U.S. Bureau of Labor Statistics. Over the last 12 months, the all items index increased 1.4% before seasonal adjustment.
The seasonally adjusted increase in the all items index was driven by an 8.4% increase in the gasoline index, which accounted for more than 60% of the overall increase. The other components of the energy index were mixed, resulting in an increase of 4% for the month. The food index rose in December, as both the food at home and the food away from home indexes increased .4%.
Important Takeaways, Courtesy of the U.S. Bureau of Labor Statistics:
- The index for all items less food and energy increased .1% in December.
- The indexes for apparel, motor vehicle insurance, new vehicles, personal care, as well as household furnishings and operations all increased month-over-month. The indexes for used cars and trucks, recreation and medical care were among those to decline.
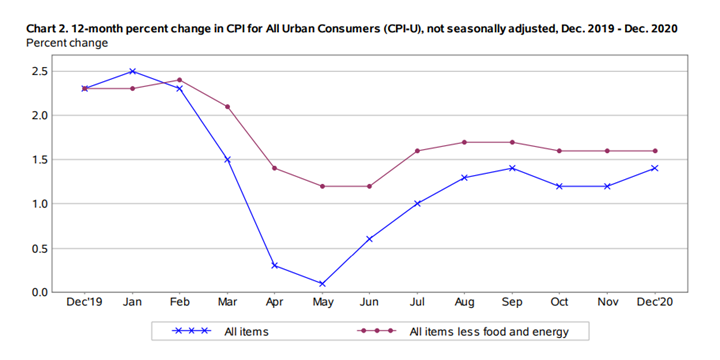
- The all items index rose 1.4% for the 12 months ending December, a slightly larger increase than the 1.2% increase reported for the period ending November. The index for all items less food and energy rose 1.6% during the same period, while the food index rose 3.9% and energy fell 7%.
Consumer Sentiment & Confidence
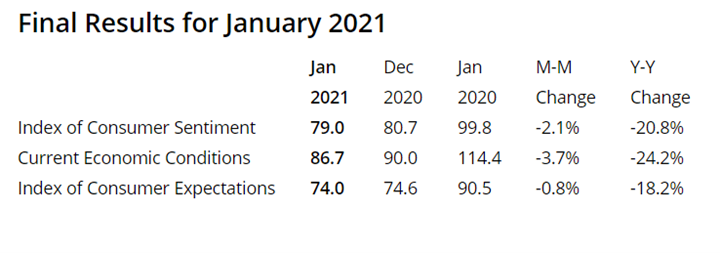
The Consumer Sentiment Index—a survey consisting of approximately 50 core questions that cover consumers’ assessments of their personal financial situation, buying attitudes and overall economic conditions—finished at 79 in January. This is down 1.7 from a month prior and remains well below the average of 97 from 2017 to 2019, according to the University of Michigan Survey of Consumers.
However, “The level of key confidence indicators remained well above prior cyclical lows despite the sudden historic collapse in economic activity,” said Richard Curtin, chief economist for the University of Michigan Survey of Consumers.
Curtin credited mask-wearing and social distancing, the quick substitution of home for office work, as well as the prompt distribution of generous federal benefits for the overall stability of consumers.
“Despite continuing job and income disparities, as precautionary motives begin to ease, accumulated savings will spark a significant gain in spending in late 2021,” said Curtin. Additionally, stimulus legislation signed into law just after Christmas will help maintain and accelerate the nation’s ongoing recovery, added Jack Kleinhenz. National Retail Federation chief economist.
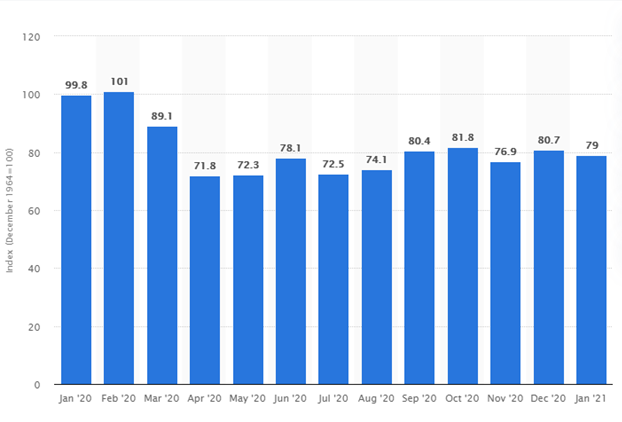
This statistic shows the U.S. Consumer Sentiment Index from January 2020 to January 2021. The index is normalized to have a value of 100 in December 1964 and based on a monthly survey of consumers, conducted in the continental United States. It consists of about 50 core questions that cover consumers’ assessments of their personal financial situation, their buying attitudes and overall economic conditions. The Consumer Sentiment Index stood at 79 in January 2021.
The Conference Board Consumer Confidence Index® improved moderately in January, after decreasing in December. The Index now stands at 89.3 (1985=100), up from 87.1 in December.
“Consumers’ appraisal of present-day conditions weakened further in January, with COVID-19 still the major suppressor,” said Lynn Franco, senior director of economic indicators at The Conference Board.
“Consumers’ expectations for the economy and jobs, however, advanced further, suggesting that consumers foresee conditions improving in the not-too-distant future. In addition, the percent of consumers who said they intend to purchase a home in the next six months improved, suggesting that the pace of home sales should remain robust in early 2021.”
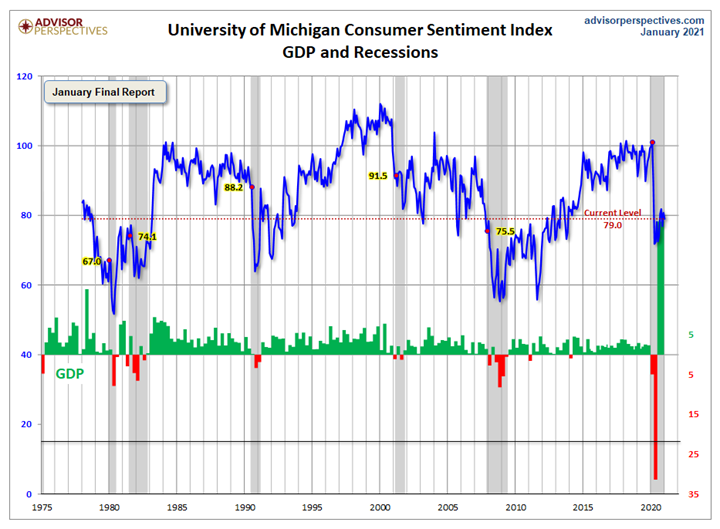
This is a long-term perspective on this widely watched indicator. Recessions and real GDP are included to help evaluate the correlation between the Michigan Consumer Sentiment Index and the broader economy, explained Advisor Perspectives, a leading interactive publisher for Registered Investment Advisors (RIAs), wealth managers and financial advisors.
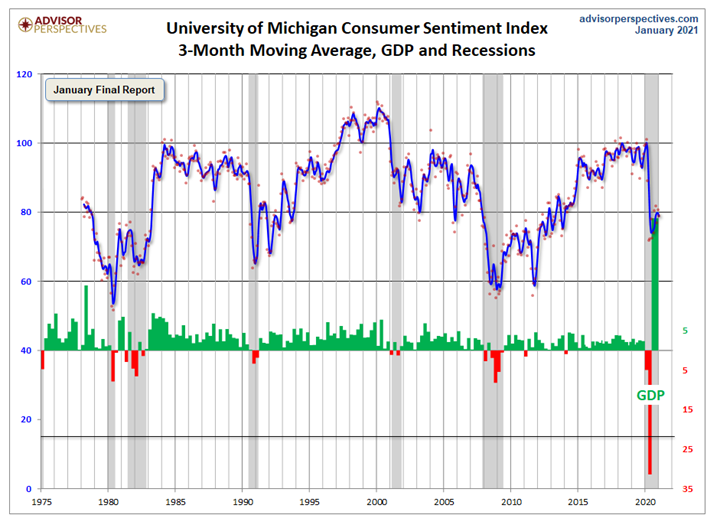
Jill Mislinski of Advisor Perspectives put the recent consumer sentiment report into a larger historical context. Consumer sentiment is 8.3% above the average reading (arithmetic mean) and 7.3% below the geometric mean. The current index level is at the 29th percentile of the 517 monthly data points in this series. Note that this indicator is somewhat volatile, with a 3.0-point absolute average monthly change. The latest data point saw a 4.5-point decrease from the previous month. For a visual sense of the volatility, here is a chart with the monthly data and a three-month moving average.
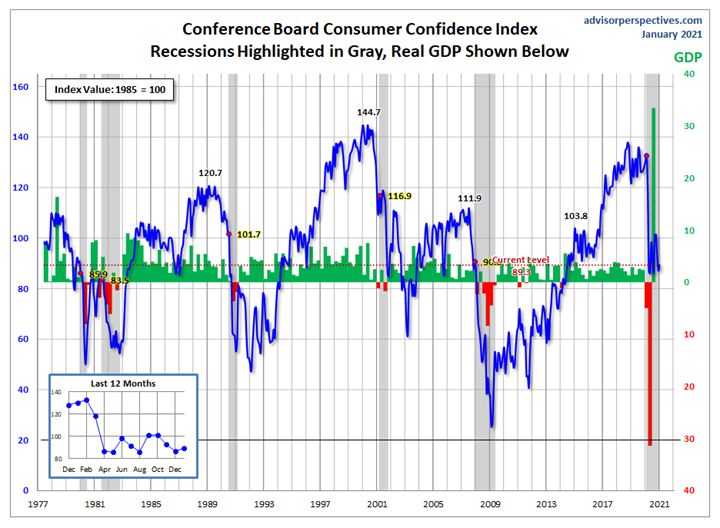
For the sake of comparison, here is a chart of the Conference Board’s Consumer Confidence Index (monthly update here). The Conference Board Index is the more volatile of the two, but the broad pattern and general trends have been remarkably similar to the Michigan Index.
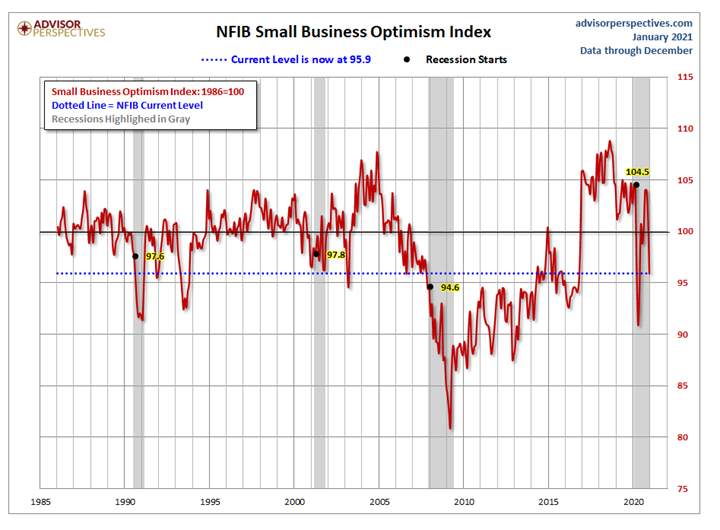
And finally, the prevailing mood of the Michigan survey is also similar to the mood of small business owners, as captured by the NFIB Business Optimism Index (monthly update here).
Consumer Spending
Even though retail sales posted a slight monthly decline, holiday sales were solid. As reported in the December Key Performance Indicator Report, the National Retail Federation (NRF) predicted holiday sales to increase approximately 3.6% – 5.2% year-over-year or a total of $755.3 billion to $766.7 billion. However, final calculations—which include online and other non-store sales, up 23.9% collectively—show unexpected growth of 8%, thereby exceeding the National Retail Federation’s holiday forecast.
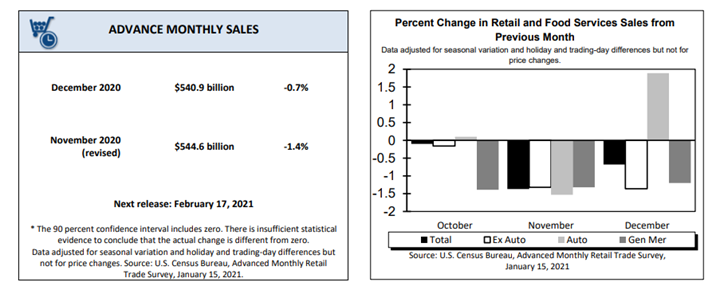
Advance estimates of U.S. retail and food services sales for December 2020—adjusted for seasonal variation and holiday and trading-day differences but not for price changes—were $540.9 billion, a decrease of .7% (±0.5) from the previous month but 2.9% (±0.7) above December 2019. Total sales for the 12 months of 2020 were up .6% (±0.4) from 2019. Total sales for the October 2020 through December 2020 period were up 4% (±0.5) from the same period a year ago. The October 2020 to November 2020 percent change was revised from down 1.1% (±0.5) to down 1.4% (±0.2). Retail trade sales were down .3% (±0.5)* from November 2020 but 6.3% (±0.7) above last year. Non-store retailers were up 19.2% (±1.6) from December 2019, while food services and drinking places were down 21.2% (±3.7) from last year.
“Despite unprecedented challenges, consumers and retailers demonstrated incredible resilience this holiday season,” said Matthew Shay, NRF President and CEO.
“Faced with the rising transmission of the virus, state restrictions on retailers and heightened political and economic uncertainty, consumers chose to spend on gifts that lifted the spirits of their families and friends and provided a sense of normalcy given the challenging year. We believe President-elect Biden’s stimulus proposal, with direct payments to families and individuals, further aid for small businesses and tools to keep businesses open, will keep the economy growing,” he added.
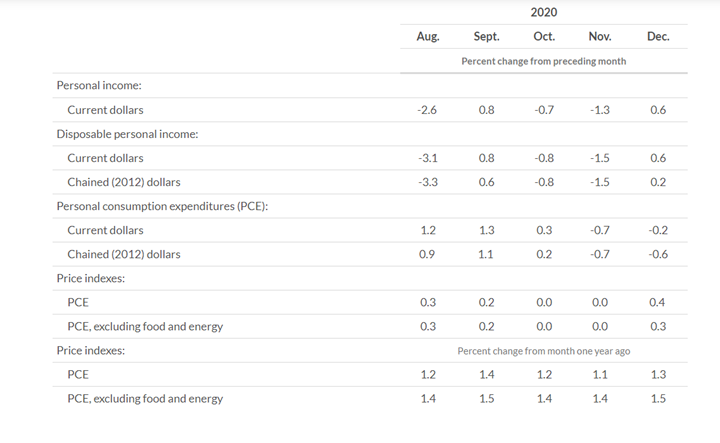
Personal income increased $116.6 billion (0.6%) in December, according to the U.S. Bureau of Economic Analysis. Disposable personal income (DPI) increased $111.6 billion (0.6%), personal consumption expenditures (PCE) decreased $27.9 billion (0.2%) and personal outlays decreased $39.2 billion. Personal saving was $2.38 trillion in December and the personal saving rate—personal saving as a percentage of disposable personal income—was 13.7%. Real DPI increased 0.2%, Real PCE decreased 0.6% and the PCE price index increased 0.4%. Excluding food and energy, the PCE price index increased 0.3%. Review the most current report detail here.
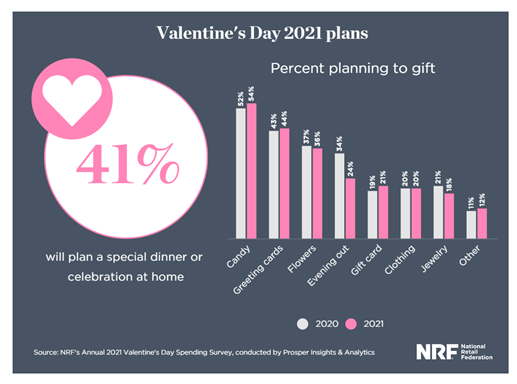
NRF has high hopes for February, too. Nearly 52% of U.S. adults plan to celebrate Valentine’s Day this year— spending a total of $21.8 billion, according to the annual survey released today by the National Retail Federation and Prosper Insights & Analytics.
“Consumers still feel it’s important to spoil their loved ones in light of the pandemic,” Prosper Insights Executive Vice President of Strategy Phil Rist said. “This year’s total and average spending figures are near record highs, as the second-highest in the survey’s history.”
Outlook: Are the increasingly upbeat economic forecasts for 2021 warranted? “Many argue that record levels of fiscal support, along with the ultra-accommodative stance of monetary authorities, have primed the U.S. economy for a strong surge in consumer spending later this year,” said Vivekanand Jayakumar, an associate professor of economics at the University of Tampa.
However, there are “distributional concerns and sector differences that may affect the overall pace and direction of consumer spending in 2021,” he explained. Learn more here.


