KPI — December: State of the Economy

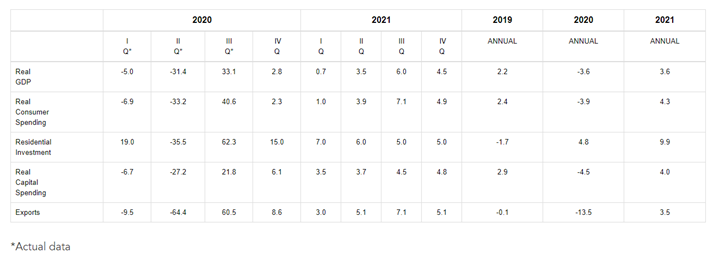
Real economic growth is likely to rise by 2.8%* (annualized rate) in 4Q20, while the US economy continues to wrestle with the COVID-19 pandemic, said The Conference Board. A deceleration in the recovery follows a contraction of 5% in 1Q20, a contraction of 31.4% in 2Q20 and a rebound of 33.1% in 3Q20, according to data from the Bureau of Economic Analysis (BEA).
The economy is showing signs of partial recovery from a deep contraction caused by the pandemic in the first half of 2020, but a variety of factors will determine how the recovery unfolds in 2021. Key variables include:
- The scale of the ongoing COVID-19 resurgence and any resulting lockdowns
- Status of labor markets and household consumption
- Size and timing of additional fiscal stimulus
- Timing and availability of a COVID-19 vaccine
- The degree to which volatility in the U.S. political transition affects consumer and business confidence
As such, The Conference Board has generated three potential recovery scenarios based on specific sets of assumptions. All data and analysis are courtesy of The Conference Board.
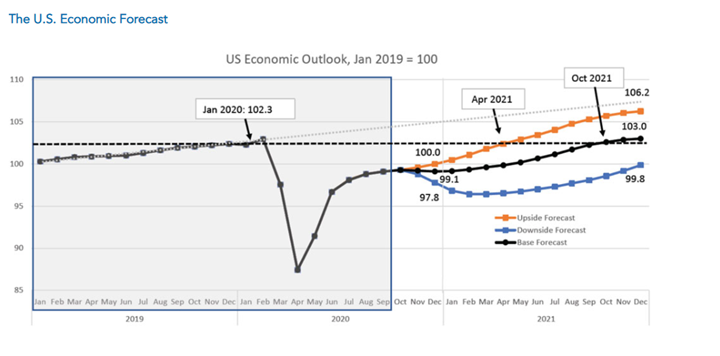
- Base Forecast: The base forecast yields real GDP growth of 2.8%* (annualized rate) during Q4, an annual contraction of 3.6% for 2020 and an annual expansion of 3.6% in 2021. The Conference Board views this scenario as the most probable and assumes: a) new cases of COVID-19 rise in 4Q20/1Q21, resulting in intermittent localized lockdowns, b) limited improvement in labor markets and consumption through the end of 2020/early 2021, c) the implementation of limited fiscal stimulus in late 1Q21/early 2Q21, d) the imminent approval of a vaccine in 4Q20, but no broad dissemination until 2Q21 and e) a political transition that does not result in a hit to consumer or business confidence. These assumptions yield a lull in the recovery in 4Q20 and 1Q21, but a steady acceleration of economic activity that peaks in the summer months as consumers eagerly spend on services and goods they had forgone in 2020. In this scenario, U.S. monthly economic output returns to pre-pandemic levels in October 2021.
- Upside Forecast: Alternatively, The Conference Board offers a second, more optimistic scenario in which the economy grows by 4% (annualized rate) in 4Q20, yielding an annual contraction of 3.5% for 2020. For 2021, the recovery continues to accelerate, resulting in an annual expansion of 6.1%. This scenario assumes: a) new COVID cases level off in 4Q20/1Q21 and do not result in lockdowns, b) a strong recovery in labor markets and consumption, c) large fiscal stimulus implemented in 1Q21, d) vaccinations getting approved in 4Q20 and becoming widely available in early 2021 and e) a political transition that does not result in a hit to consumer or business confidence. These assumptions lead to U.S. monthly economic output returning to pre-pandemic levels by April 2021.
- Downside Forecast: A third, more pessimistic scenario is the U.S. economy contracting in 4Q20 and 1Q21 before stabilizing later in 2021. This so-called “double-dip”** recession scenario yields a 3.8% economic contraction in 2020 and growth of .1% in 2021. It assumes a) a large spike in COVID-19 cases in 4Q20 and 1Q2, resulting in widespread lockdowns, b) a deterioration in labor markets and spending, c) no additional fiscal stimulus in 2021, d) no vaccine broadly available in 2021 and e) a very bumpy political transition that disrupts business and consumer confidence. Under this scenario, U.S. monthly economic output does not recover to pre-pandemic levels until sometime in 2022.
* The Conference Board is adjusting its forecast of 4Q20 real GDP growth from 2.2% (annualized rate) to 2.8% (annualized rate). This change is due to stronger than expected November economic indicators, including recently published Purchasing Management Index (PMI) and Personal Consumption Expenditures (PCE) data.
** The National Bureau of Economic Research (NBER) does not define a special category of recession called a “double-dip” recession. If there is another large contraction in economic activity over the coming months NBER will likely either classify this period as a continuation of the recession that it said began in February 2020 (link), or a separate recession that followed the first. At present, the NBER has not announced that the first recession has ended.
Employment
Total nonfarm payroll employment increased by 245,000 in November, and the unemployment rate decreased to 6.7%. For perspective, the rate is down by eight percentage points compared to a recent high in April but is 3.2 percentage points higher than it was in February. Likewise, the number of unemployed persons decreased to 10.7 million in November, yet the number is 4.9 million higher than in February.
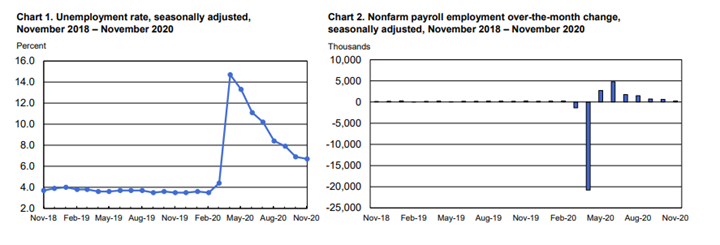
“These improvements in the labor market reflect the continued resumption of economic activity that had been curtailed due to the coronavirus (COVID-19) pandemic and efforts to contain it. However, the pace of improvement in the labor market has moderated in recent months,” explained the U.S. Bureau of Labor Statistics.
- The number of persons on temporary layoff in November decreased by 441,000 to 2.8 million. This measure is down considerably from the high of 18.1 million in April but remains two million above the February level.
- The number of permanent job losers is 3.7 million, relatively unchanged from a month prior but 2.5 million higher than in February.
- The number of long-term unemployed (those jobless for 27+ weeks) increased by 385,000 to 3.9 million, accounting for 36.9% of the total unemployed. The number of persons jobless 15 – 26 weeks declined by 760,000 to 1.9 million, while the number of persons jobless 5 – 14 weeks and less than five weeks showed little change in November (2.4 million and 2.5 million, respectively).
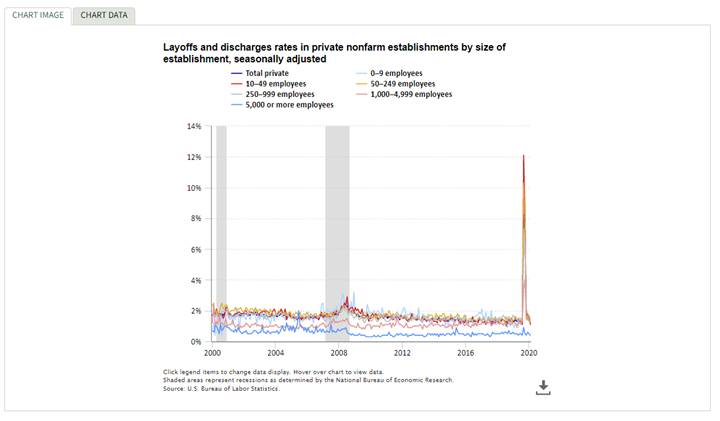
According to the U.S. Bureau of Labor Statistics, the layoffs and discharges rate in private nonfarm establishments reached a historical high of 8.8% in March 2020 as the COVID-19 pandemic began. The rate remained high in April at 6.9%. Layoffs and discharges rates in May, June, July and August were similar to those before the pandemic. Establishments with 10 to 49 employees had the highest layoffs and discharge rates in March and April, followed by establishments with 50 to 249 employees. Establishments with 1,000 to 4,999 employees experienced increases in their layoffs and discharge rates in March and April, but the rates were lower than those for smaller and medium-sized establishments. By August, there was little difference in layoffs and discharges rates by establishment size, except for the largest establishments. The rate for establishments with 5,000 or more employees reached 0.9% in March 2020. The rate was 0.4% in August, around the same rate it has been for much of its history since December 2000.
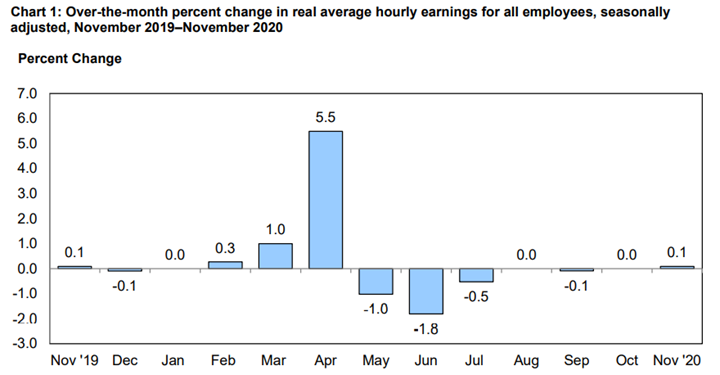
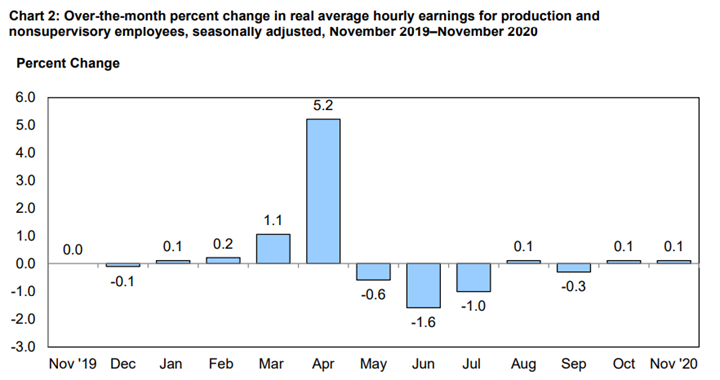
Additionally, real average hourly earnings for all employees increased .1% from October to November (seasonally adjusted). This result stems from an increase of .3% in average hourly earnings combined with an increase of .2% in the Consumer Price Index for All Urban Consumers (CPI-U), according to the U.S. Bureau of Labor Statistics. Real average weekly earnings increased .1% month-over-month due to the change in real average hourly earnings combined with no change in the average workweek.
In November, real average hourly earnings increased by 3.2% year-over-year (seasonally adjusted). The change in real average hourly earnings combined with an increase of 1.5 percent in the average workweek resulted in a 4.7-percent increase in real average weekly earnings over this period.
By Demographic
Unemployment rates among all major worker groups in November: adult women – 6.1%, adult men – 6.7%, teenagers – 14%, Whites – 5.9%, Asians – 6.7%, Hispanics – 8.4% and Blacks – 10.3%.
Unemployment rates among all major worker groups in October: adult women—6.5%, adult men—6.7%, teenagers—13.9%, Whites—6%, Asians—7.6%, Hispanics—8.8% and Blacks—10.8%.
Unemployment rates among all major worker groups in September: adult men—7.4%, adult women—7.7%, teenagers—15.9%, Whites—7%, Asians—8.9%, Hispanics—10.3% and Blacks—12.1%.
By Industry
In November, total nonfarm payroll employment increased by 245,000, following gains of larger magnitude during the past six months. Nonfarm employment was below its February level by 9.8 million, or 6.5%.
Notable job gains occurred in transportation and warehousing, professional and business services, as well as health care. Employment declined in government and retail trade.
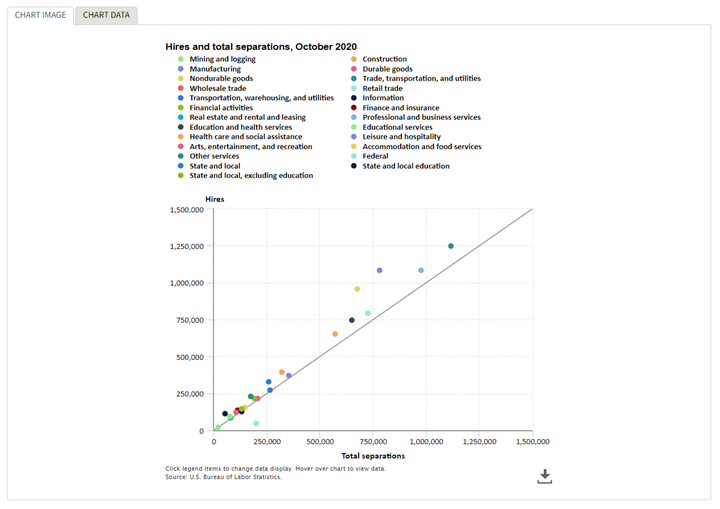
In October 2020, the number of hires was approximately 5.8 million. During the same period, total separations were approximately 5.1 million. Trade, transportation and utilities reported the largest number of hires at approximately 1.2 million. This industry also had the largest number of separations at approximately 1.1 million.
Important takeaways, courtesy of the U.S. Bureau of Labor Statistics:
- Transportation and warehousing increased by 145,000 in November but is 123,000 below its February level. Employment increased by 82,000 in couriers/messengers and 37,000 in warehousing and storage.
Since February, employment in these industries has increased by 182,000 and 97,000, respectively. Job growth also occurred month-over-month in truck transportation (+13,000).
- Professional and business services increased by 60,000, with about half the gain occurring in temporary help services (+32,000). Job growth also occurred in services to buildings and dwellings (+14,000). Employment in professional and business services is down by 1.1 million since February.
- Health care added 46,000 jobs, with gains occurring in offices of physicians (+21,000), home health care services (+13,000), as well as offices of other health practitioners (+8,000). Nursing care facilities continued to lose jobs (-12,000). Health care employment is 527,000 lower than in February.
- Construction gained 27,000 jobs, but employment is 279,000 below its February level. Employment rose in residential specialty trade contractors (+14,000) and in heavy and civil engineering construction (+10,000).
- Manufacturing employment increased by 27,000. Job gains occurred in motor vehicles and parts (+15,000), as well as in plastics and rubber products (+5,000). Employment in manufacturing was 599,000 lower than in February.
- Financial activities added 15,000 jobs, with gains in real estate (+10,000) and in non-depository credit intermediation (+8,000). Financial activities added 164,000 jobs over the past seven months, but employment in the industry is 115,000 lower than in February.
- Employment in wholesale trade continued to trend up in November (+10,000) but is 281,000 lower than in February.
- Government employment declined for the third consecutive month, decreasing by 99,000 most recently. A decline of 86,000 in federal government employment reflected the loss of 93,000 temporary workers who were hired for the 2020 Census. Employment in local government education continued to trend down (-21,000).
- Retail trade lost 35,000 jobs, reflecting less seasonal hiring in several retail industries. Employment decreases occurred in general merchandise stores (-21,000); sporting goods, hobby, book and music stores (-12,000); electronics and appliance stores (-11,000); and health and personal care stores (-8,000). By contrast, furniture and home furnishings stores and automobile dealers added 6,000 jobs and 4,000 jobs, respectively. Employment in retail trade is 550,000 lower than in February.
- Leisure and hospitality changed little in November (+31,000) but is down by 3.4 million since February. Arts, entertainment and recreation added 43,000 jobs in November, while employment in food services and drinking places changed little (-17,000).
- Employment in other major industries, including mining, information and other services, showed little change in November.
By Geography
At the time of writing, the most current data available is October. The unemployment rates were lower in 37 states and the District of Columbia, higher in eight states and stable in five states, according to the U.S. Bureau of Labor Statistics. (For comparison, last month’s reporting noted unemployment rates were lower during September in 30 states, higher in eight states and stable in 12 states—including the District of Columbia). Forty-seven states and the District had jobless rate increases from a year earlier and three states reported little or no change.
Additionally, nonfarm payroll employment increased in 32 states, decreased in two states and was essentially unchanged in 16 states, including the District of Columbia. Over the year, nonfarm payroll employment decreased in 48 states and the District; it was essentially unchanged in two states.
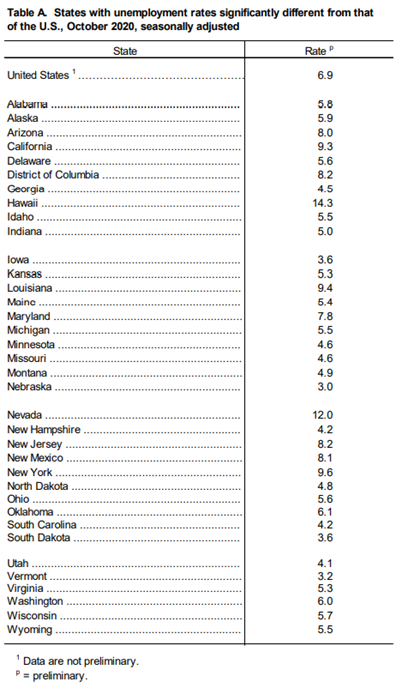
Hawaii reported the highest unemployment rate at 14.3 percent, followed by Nevada at 12%.
Nebraska and Vermont boasted the lowest rates at 3% and 3.2%, respectively. In total, 26 states had jobless rates lower than the U.S. figure of 6.9%, while nine states and the District of Columbia posted higher rates. Fifteen states had rates that were not appreciably different from that of the nation.
In October, the largest unemployment rate decreases occurred in Illinois (-3.6 percentage points) and Rhode Island (-3.5 points). Month-over-month, rates declined by at least two percentage points in an additional six states, while the largest jobless rate increase occurred in Kentucky (+1.8 percentage points).
Nonfarm payroll employment increased in 32 states, decreased in two states and was essentially unchanged in 16 states, including the District of Columbia.
The largest job gains occurred in California (+145,500), Texas (+118,100) and Florida (+51,600). The largest percentage increases occurred in Alaska (+2.9%), Hawaii (+2%), as well as Louisiana and Wyoming (+1.2% each). Employment decreased in Wisconsin (-14,700, or -0.5%) and New Hampshire (-3,700, or -0.6%).
Over the year, nonfarm payroll employment decreased in 48 states, including the District of Columbia, and was essentially unchanged in two states. The largest job declines occurred in California (-1,369,400), New York (-1,015,500), and Texas (-499,200). The largest percentage declines occurred in Hawaii (-17.3%), New York (-10.4%) and Vermont (-9.3%).