KPI — December: Consumer Trends

Below is a synopsis of consumer confidence, sentiment and spending trends.
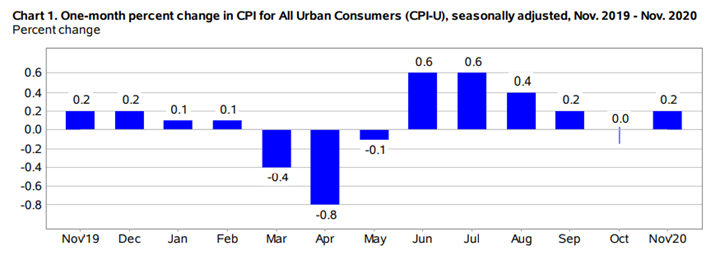
The Consumer Price Index for All Urban Consumers (CPI-U) increased .2% in November on a seasonally adjusted basis after being unchanged in October, reported the U.S. Bureau of Labor Statistics. Over the last 12 months, the all items index increased 1.2% before seasonal adjustment.
The seasonally adjusted increase in the all items index was broad-based, with no component accounting for more than a quarter of the increase. For example, the food index declined in November, as a decrease in the food at home index more than offset a small increase in the food away from home index. The index for energy increased in November, as increases in indexes for natural gas and electricity more than offset a decline in the index for gasoline.
Important Takeaways, Courtesy of the U.S. Bureau of Labor Statistics:
- The index for all items less food and energy increased .2% after being unchanged a prior month.
- The indexes for lodging away from home, household furnishings and operations, recreation, apparel, airline fares and motor vehicle insurance all increased, while indexes for used cars and trucks, medical care and new vehicles all declined month-over-month.
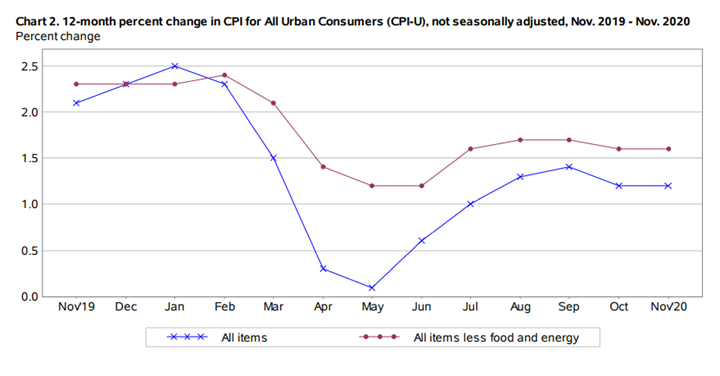
- The index for all items less food and energy increased 1.6% during the last 12 months.
- The food index rose 3.7% during the last 12 months, while the energy index fell 9.4%.
Consumer Sentiment & Confidence
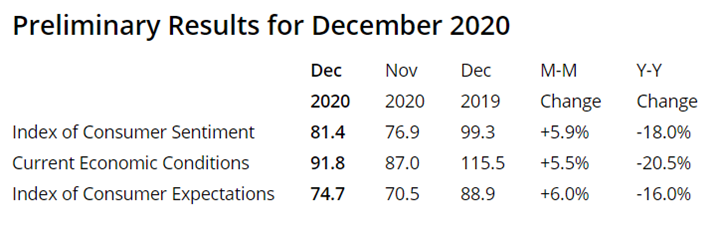
The Consumer Sentiment Index—a survey consisting of approximately 50 core questions that cover consumers’ assessments of their personal financial situation, buying attitudes and overall economic conditions—finished at 76.9 in November, down from 81.8 in October and far below last November’s 96.8, according to University of Michigan Survey of Consumers.
Nowadays, the market is more vulnerable than ever and reacts quickly to disapproving news. “Consumer sentiment fell in November due to a sharp decline in economic prospects. If coronavirus infections and deaths rise as anticipated in the months ahead, further declines in optimism are likely,” said Richard Curtin, chief economist for the University of Michigan Survey of Consumers.
Half of all consumers expect conditions in the economy to be unfavorable in 2021, including slightly higher inflation and unemployment rates, noted Curtin. However, the December Preliminary is 81.4, up 4.5 from the November final.
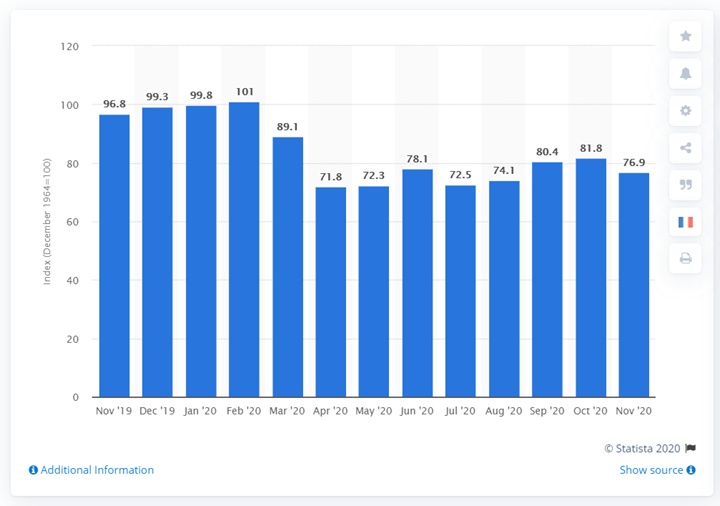
This statistic shows the U.S. Consumer Sentiment Index from November 2019 to November 2020. The index is normalized to have a value of 100 in December 1964 and based on a monthly survey of consumers, conducted in the continental United States. It consists of about 50 core questions, which cover consumers’ assessments of their personal financial situation, their buying attitudes and overall economic conditions. The Consumer Sentiment Index stood at 76.9 in November 2020.
The Conference Board Consumer Confidence Index® declined in November as well, after remaining relatively flat in October. The Index now stands at 96.1 (1985=100), down from 101.4 (an upward revision) in October.
“Consumer confidence declined in November, after remaining virtually flat in October,” said Lynn Franco, senior director of economic indicators at The Conference Board. “Consumers’ assessment of present-day conditions held steady, though consumers noted a moderation in business conditions, suggesting growth has slowed in Q4. Heading into 2021, consumers do not foresee the economy, nor the labor market, gaining strength. In addition, the resurgence of COVID-19 is further increasing uncertainty and exacerbating concerns about the outlook,” she added.
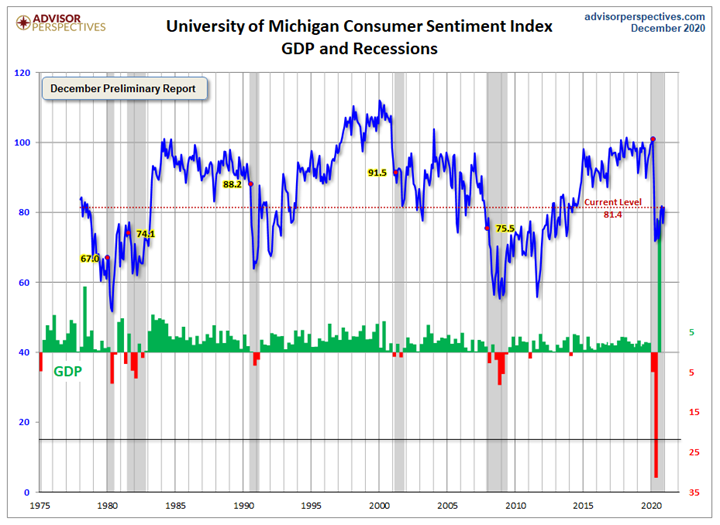
This is a long-term perspective on this widely watched indicator. Recessions and real GDP are included to help evaluate the correlation between the Michigan Consumer Sentiment Index and the broader economy, explained Advisor Perspectives, a leading interactive publisher for Registered Investment Advisors (RIAs), wealth managers and financial advisors.
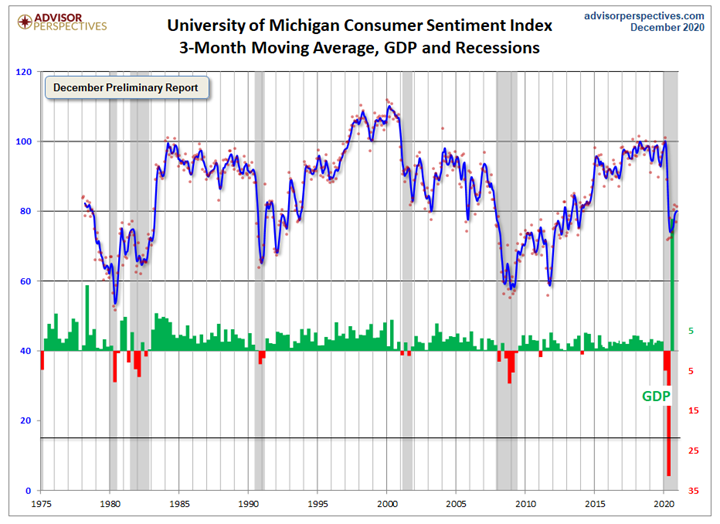
Jill Mislinski of Advisor Perspectives put the recent consumer sentiment report into a larger historical context. Consumer sentiment is 10.4% above the average reading (arithmetic mean) and 7% below the geometric mean. The current index level is at the 32nd percentile of the 516 monthly data points in this series. Note that this indicator is somewhat volatile, with a 3.0-point absolute average monthly change. The latest data point saw a 4.5-point decrease from the previous month. For a visual sense of the volatility, here is a chart with the monthly data and a three-month moving average.
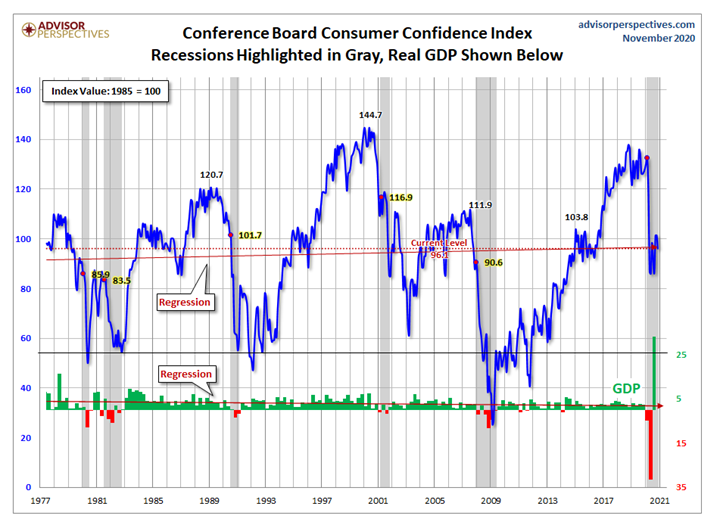
For the sake of comparison, here is a chart of the Conference Board’s Consumer Confidence Index (monthly update here). The Conference Board Index is the more volatile of the two, but the broad pattern and general trends have been remarkably similar to the Michigan Index.
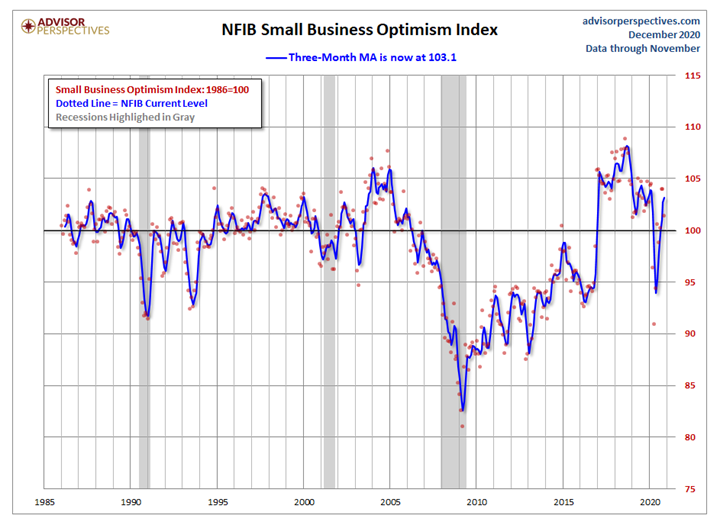
And finally, the prevailing mood of the Michigan survey is also similar to the mood of small business owners, as captured by the NFIB Business Optimism Index (monthly update here).
Undeniably, consumers are nervous about rising COVID-19 cases, a lack of bipartisan support for additional fiscal stimulus and the unresolved status regarding control of the U.S. Senate, noted MarketWatch.
“The resurgence of COVID infections and deaths in the months ahead is likely to promote more firm closures and stay-at-home orders in addition to mandatory wearing of face masks and social distancing,” said Curtin.
Widespread closures will cause severe hardships for some households and significantly slow economic recovery. Furthermore, a delay in federal aid until next year also would permit great harm and permanent damage for many households, firms and local governments, added Curtin. “Immediate action by the current administration and Congress is urgently needed to secure the continuation of the economic recovery and to ensure the welfare of all households,” he said.
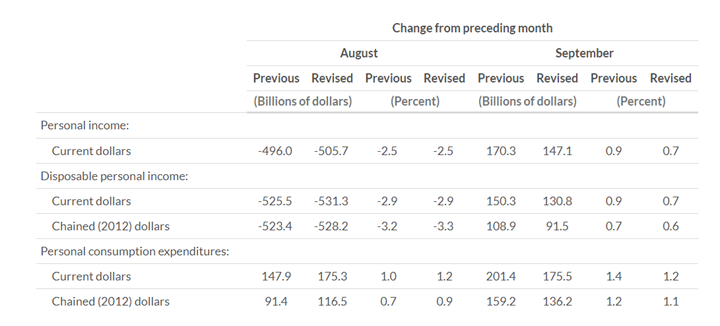
Personal Income and Outlays, October 2020
Also on the decline, recent reporting from the Bureau of Economic Analysis estimates personal income dipped $130.1 billion (.7%), disposable personal income (DPI) decreased $134.8 billion (.8%) and personal consumption expenditures (PCE) increased $70.9 billion (.5%).
“The decrease in personal income in October was led by a decrease in government social benefits. Within government social benefits, ‘other’ social benefits decreased, which primarily reflected a decrease in Lost Wages Supplemental Payments, a Federal Emergency Management Agency program that provides wage assistance to individuals impacted by the pandemic,” according to the Bureau of Economic Analysis.
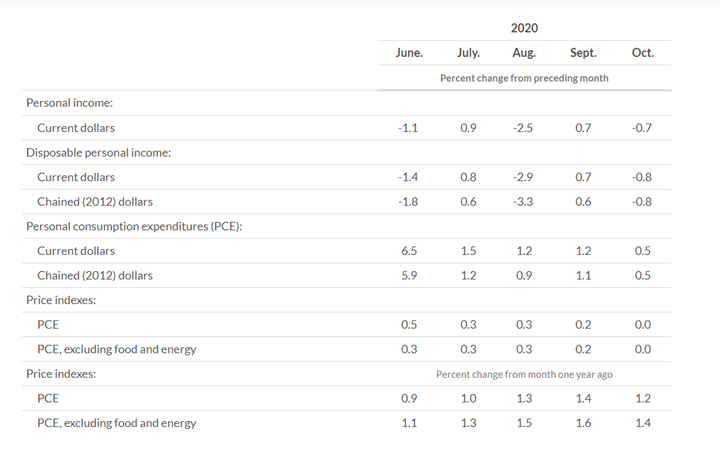
Personal saving was $2.38 trillion and the personal saving rate—personal saving as a percentage of disposable personal income—registered at 13.6%.
“Offsetting the decrease in government social benefits were increases in compensation and proprietors’ income (led by farm). Within compensation, an increase in private wages and salaries was partly offset by a decrease in government wages and salaries, which decreased $8.4 billion in October, following a decrease of $8.2 billion in September and an increase of $22.8 billion in August,” according to the Bureau of Economic Analysis.
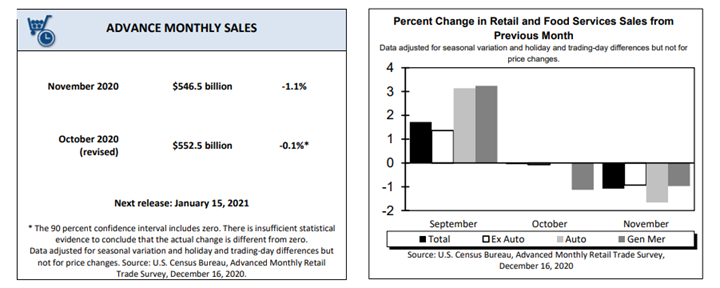
For the first time since April, U.S. retail sales declined in spending at stores, car dealerships, restaurants and e-commerce during November, reported Retail Touchpoints®, an online publishing network for retail executives.
Despite a 1.1% month-over-month decrease (to $546.5 billion), year-over-year projections still show a gain of 4.1% (±0.7 percent), and total sales for September 2020 through November 2020 remain up 5.2% (±0.5 percent) compared to a year ago, according to data from the Commerce Department.
National Retail Federation (NRF) calculations were slightly more positive, with the organization reporting a November sales decline of .3% (seasonally adjusted from October) but up 8.8% unadjusted year-over-year, according to Retail Touchpoints®.
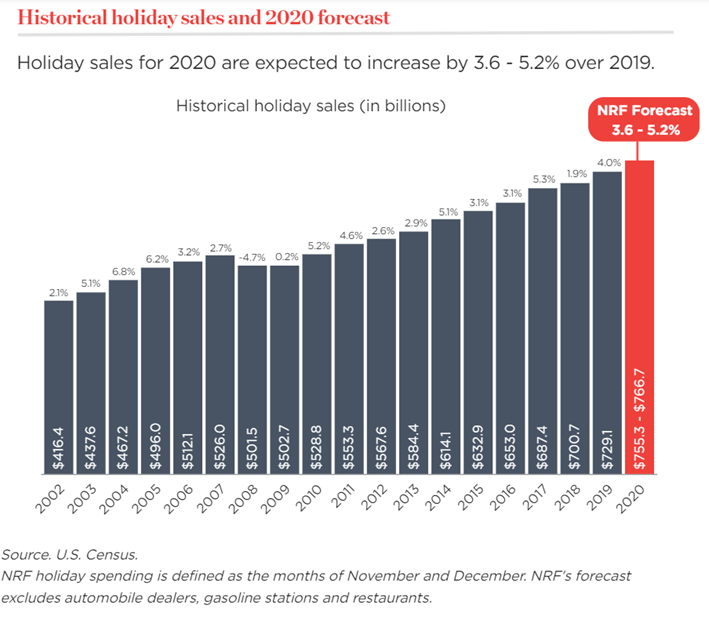
NRF expects holiday sales in November and December to increase between 3.6% – 5.2% year-over-year. Read the full story here.
Key Performance Indicators Report — December 2020