
- KPI – December 2025: The Brief
- KPI – December 2025: Recent Vehicle Recalls
- KPI – December 2025: State of Business – Automotive Industry
- KPI – December 2025: State of Manufacturing
- KPI – December 2025: Consumer Trends
Employment
Total nonfarm payroll employment was 64,000 in November – above the Dow Jones estimate of 45,000. Employment continued to trend up in health care and construction, while job losses occurred in federal government.
According to the U.S. Bureau of Labor Statistics, the unemployment rate and number of unemployed persons was 4.6% and 7.8 million, respectively. In addition, the labor force participation and long-term unemployed (those jobless for 27 weeks or more) rates registered 62.5% and 24.3%, respectively.
According to the White House, “Workers’ wages are rising, prices are falling, trillions of dollars in investments are pouring into our country and the American economy is primed to boom in 2026.”
However, others remain skeptical – expressing the U.S. economy is in a jobs recession. “The nation has added a mere 100,000 in the past six months. The bulk of those jobs were in health care, an industry that is almost always hiring due to America’s aging population,” says Heather Long, chief economist at Navy Federal Credit Union.
Laura Ullrich, director of economic research for the Indeed Hiring Lab, agrees with the sentiment, stating, “This incomplete and unconventional jobs report… paints a sobering picture of a job market that may officially be turning frigid after a prolonged cooling period.”
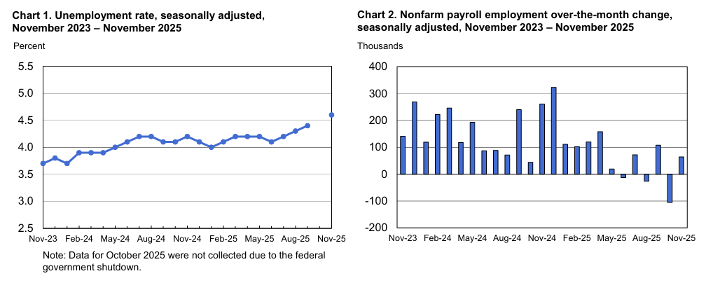
Caption: According to Fox Business reports, job gains during the prior two months were both revised in the September report. Job creation in July was revised down by 7,000, from a gain of 79,000 to 72,000. Likewise, job creation for August was revised down by 26,000, from a gain of 22,000 to a loss of 4,000.
By Demographic
This month, unemployment among the major worker groups: adult women – 4.1%; adult men – 4.1%; teenagers – 16.3%; Asians – 3.6%; Whites – 3.9%; Hispanics – 5%; and Blacks – 8.3%.
Last month, unemployment rates among the major worker groups: adult women – 4.2%; adult men – 4%; teenagers – 13.2%; Asians – 4.4%; Whites – 3.8%; Hispanics – 5.5%; and Blacks – 7.5%.
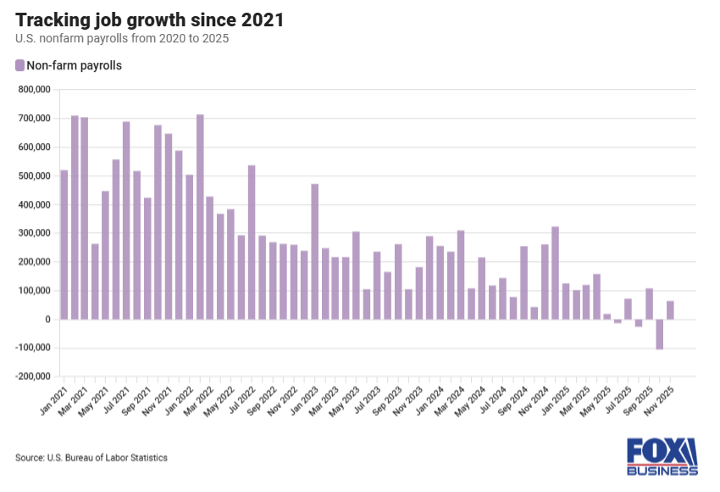
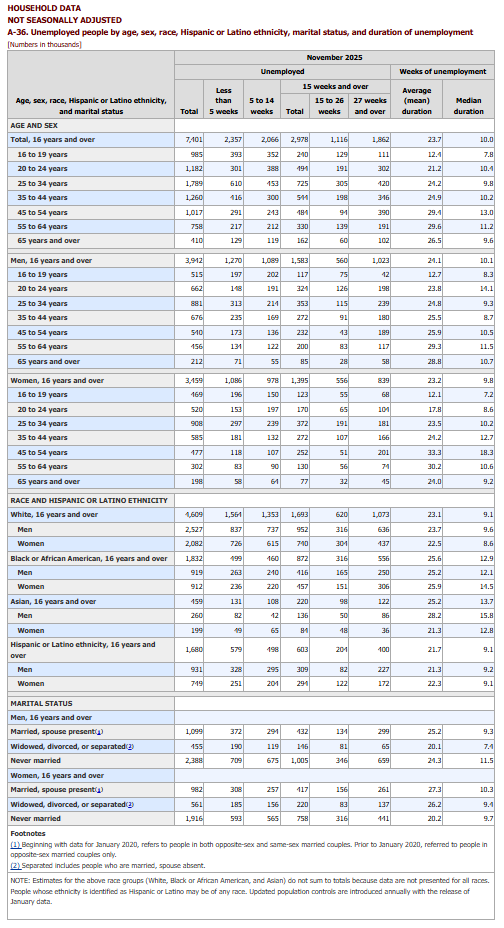 Image Source:
 By Industry
At 105.80, the Conference Board Employment Trends Index (ETI) posted slightly weaker results in October and November.
According to the Conference Board, the combined decrease in the Employment Trends Index was a result of consecutive negative contributions from two of its eight components: the Ratio of Involuntarily Part-time to All Part-time Workers and the Number of Employees Hired by the Temporary-Help Industry. The following five components showed consecutive positive contributions: the Percentage of Firms with Positions Not Able to Fill Right Now, Initial Claims for Unemployment Insurance, Job Openings, Real Manufacturing and Trade Sales, as well as Industrial Production. One component contributed negatively in October and positively in November — the Percentage of Respondents Who Say They Find “Jobs Hard to Get.”
“The ETI declined in October and November as data delayed by the government shutdown continued to show gradual softening in certain aspects of the labor market,” says Mitchell Barnes, economist at The Conference Board.
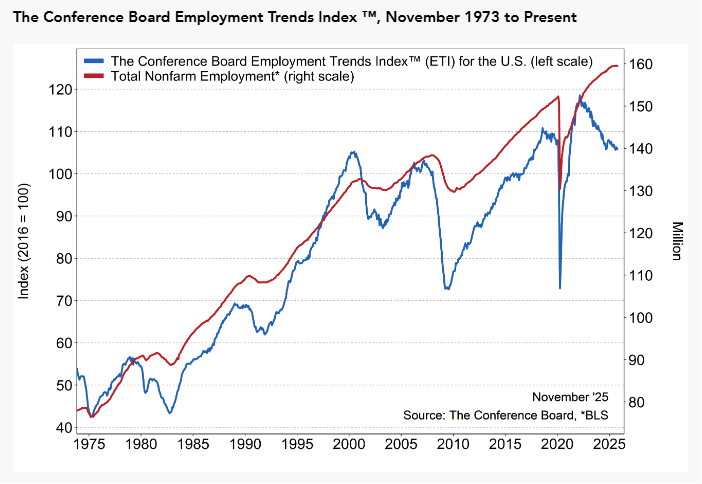
Caption: The Employment Trends Index is a leading composite index for payroll employment. When the Index increases, employment is likely to grow as well, and vice versa. Turning points in the Index indicate that a change in the trend of job gains or losses is about to occur in the coming months. Due to the U.S. federal government shutdown, all further data releases for the Conference Board Employment Trends Index (ETI) may be delayed. The Conference Board will resume publication once updated U.S. federal government data are released.
He cites the share of involuntary part-time workers (an ETI component) rose from 16.8% in September to 19.2% in November. Note: missing October data was interpolated.
Data also showed that employment in the temporary-help industry fell even further in October and November, continuing to decline from its post-pandemic high in 2022. Yet, initial claims for unemployment insurance declined in October and November after touching recent highs in September.
“The recent data reinforce the theme that the U.S. labor market has normalized into a low-turnover environment,” Barnes says. “Labor market dynamics continue to point to slowing labor demand alongside moderating supply, but conditions remained roughly in balance as businesses navigate an uncertain economic outlook.”
Key takeaways, courtesy of ETI:
- Real manufacturing and trade sales, as well as industrial production, continued to hold steady through July and September.
- JOLTS job openings also remained stable in October at 7.7 million, following an increase of 400,000 in September. The share of consumers who said “jobs are hard to get” – an ETI component from the Consumer Confidence Survey – declined from 18.2% in September to 17.9% in November.
- The share of small firms reporting jobs are “not able to be filled right now” ticked up modestly in November (33%), after three consecutive months at its post-pandemic low point of 32%.
“Confidence among businesses and consumers remains tepid,” Barnes says. “The key question to close 2025 is whether economic uncertainty will continue to dampen hiring demand or confidence begins to lift with greater policy clarity.”
Click here to view more detailed information by industry.


