KPI — December 2022: Consumer Trends

The Conference Board Consumer Confidence Index® dipped again in November after losing ground in October. The Index now stands at 100.2 (1985=100), down from 102.2 a month prior. The Present Situation Index – based on consumers’ assessment of current business and labor market conditions – decreased to 137.4 from 138.7 last month. The Expectations Index – based on consumers’ short-term outlook for income, business and labor market conditions – declined to 75.4 from 77.9.
“Consumer confidence declined again in November, most likely prompted by the recent rise in gas prices,” says Lynn Franco, senior director of economic indicators at The Conference Board. “The Present Situation Index moderated further and continues to suggest the economy has lost momentum as the year winds down. Consumers’ expectations regarding the short-term outlook remained gloomy. Indeed, the Expectations Index is below a reading of 80, which suggests the likelihood of a recession remains elevated.”
Inflation expectations increased to their highest level since July, with both gas and food prices as the main culprits. Intentions to purchase homes, automobiles and big-ticket appliances all cooled.
Looking ahead, Franco says the combination of inflation and interest rate hikes will continue to pose challenges to confidence and economic growth into early 2023.

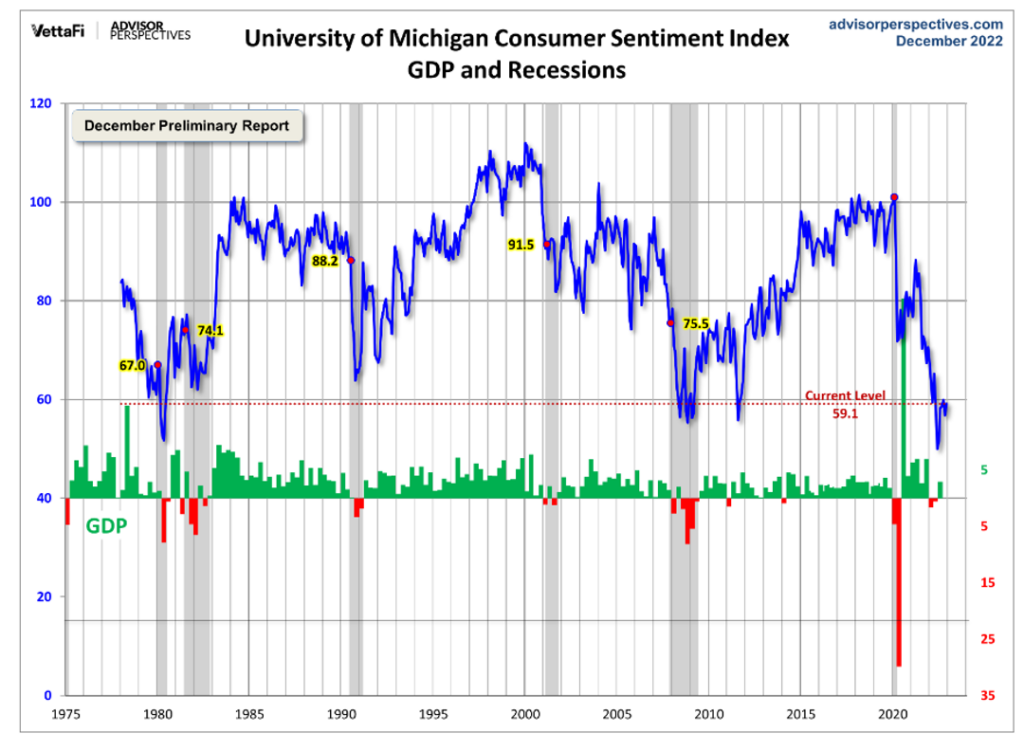
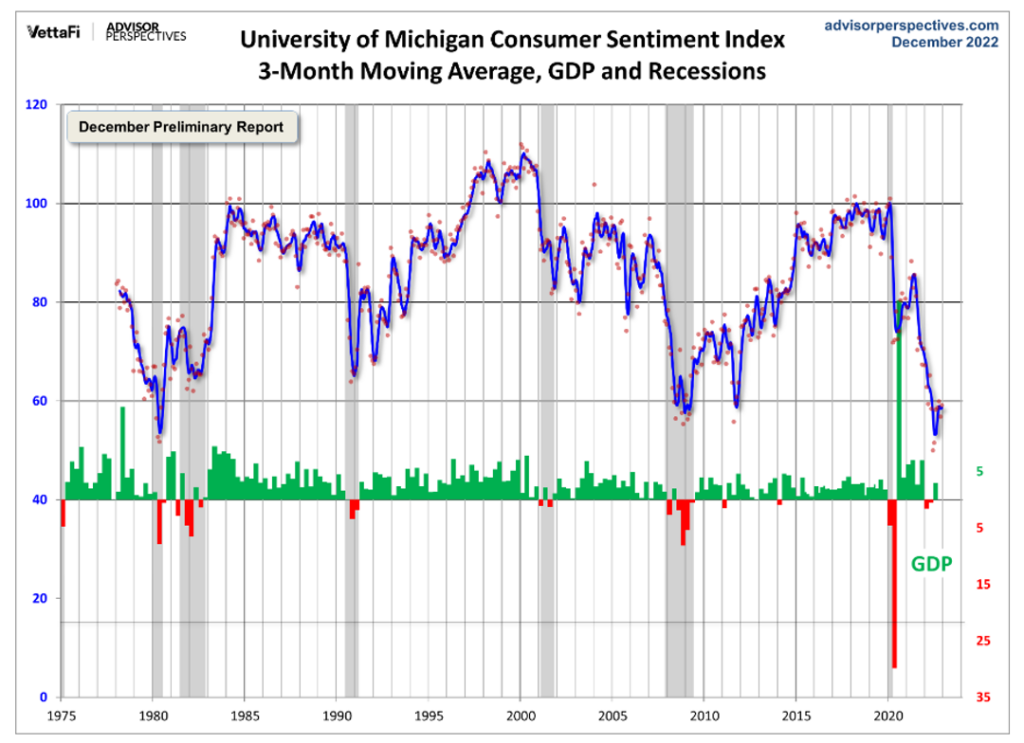
The chart evaluates the historical context for this index as a coincident indicator of the economy. Toward this end, Advisor Perspectives highlighted recessions and included GDP. To put the current report into larger historical context since its beginning in 1978, consumer sentiment is 31% below the average reading (arithmetic mean) and 30% below the geometric mean. The current index level is at the 3rd percentile of the 540 monthly data points in this series. Note that this indicator is somewhat volatile, with a three-point absolute average monthly change. The latest data point saw a 2.3-point increase from the previous month.
The Consumer Sentiment Index December Preliminary Report is currently 59.1, approximately 4% above November but still low from a historical perspective, according to the University of Michigan Survey of Consumers.
Important Takeaways, Courtesy of Survey of Consumers:
- Year-ahead inflation expectations improved considerably but remained relatively high, falling from 4.9% to 4.6% in December – the lowest reading in 15 months.
- Declines in short-run inflation expectations were visible across the distribution of age, income, education, as well as political party identification.
- At 3%, long run inflation expectations have stayed within the narrow (albeit elevated) 2.9-3.1% range for 16 of the last 17 months.

Consumer Income & Spending
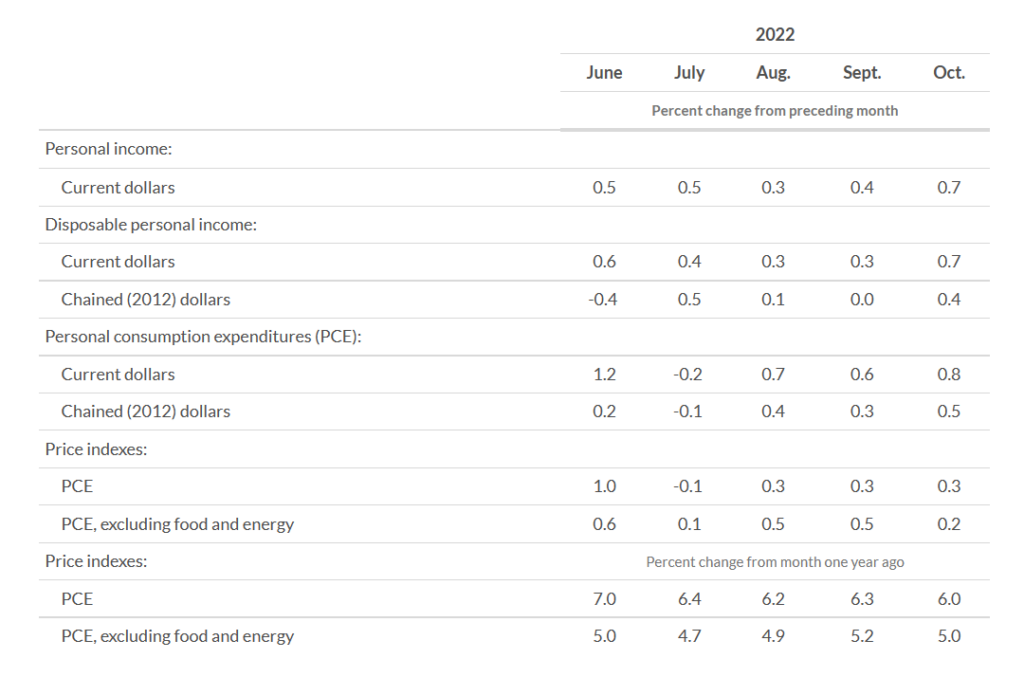
According to the U.S. Bureau of Economic Analysis (BEA), personal income, disposable personal income and personal consumption expenditures all increased in October – $155.3 billion (0.7%), $132.9 billion (0.7%) and $147.9 billion (0.8%), respectively.
In addition, personal outlays increased $154.2 billion in October. Personal saving registered $426.5 billion and the personal saving rate – personal saving as a percentage of disposable personal income – was 2.3%.

Important Takeaways, Courtesy of BEA:
- The $147.9 billion increase in current-dollar PCE in October reflected an increase of $85.9 billion in spending for goods and an increase of $61.9 billion in spending for services. Within goods, new motor vehicles (led by light trucks), gasoline and other energy goods drove the increase. Within services, spending for food services and accommodations were the largest contributing factors.
- The PCE price index for October increased 0.3% month-over-month. Prices for goods increased 0.3% as well, reflecting an increase in prices for nondurable goods (led by gasoline and other energy goods) that was partly offset by widespread decreases in prices for durable goods. Prices for services increased 0.4% (led by food services and accommodations, plus housing services).
- The PCE price index for October increased 6% year-over-year. Prices for goods increased 7.2% and prices for services increased 5.4%. Food prices increased 11.6% and energy prices increased 18.4%. Excluding food and energy, the PCE price index increased 5% year-over-year.
Key Performance Indicators Report — December 2022


