KPI — August 2023: Consumer Trends
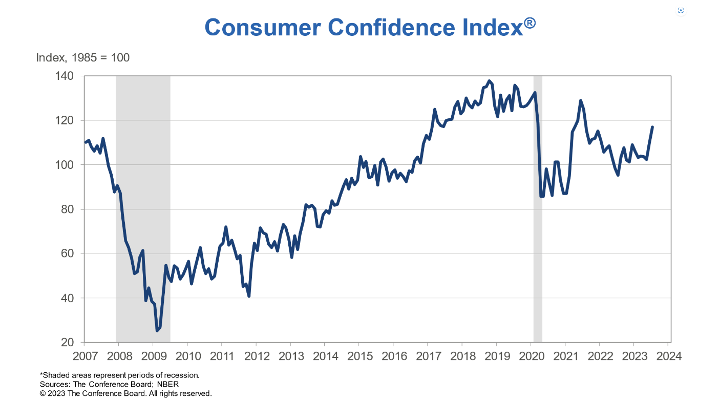
The Conference Board Consumer Confidence Index® increased to 117.0 (1985=100) in July, up from 110.1 a month ago. The Present Situation Index – based on consumers’ assessment of current business and labor market conditions – improved to 160.0 (1985=100) from 155.3 last month. The Expectations Index – based on consumers’ short-term outlook for income, business and labor market conditions – improved to 88.3 (1985=100) from 80.0 in June. Noteworthy, expectations climbed well above 80, a level which historically signals a recession within the next year. Despite rising interest rates, data shows consumers are more “upbeat” compared to recent months.
“Consumer confidence rose in July 2023 to its highest level since July 2021, reflecting pops in both current conditions and expectations,” says Dana Peterson, chief economist at The Conference Board. “Headline confidence appears to have broken out of the sideways trend that prevailed for much of the last year.”
According to recent data, “greater confidence” was evident across all age groups – specifically among consumers earning incomes less than $50,000 and those making more than $100,000.
Consumers expressed “brighter views” of employment conditions, future business conditions and job availability, as well as family finances. Despite an increase in the Expectations Index, however, consumer assessments of recessionary conditions ticked up in July.
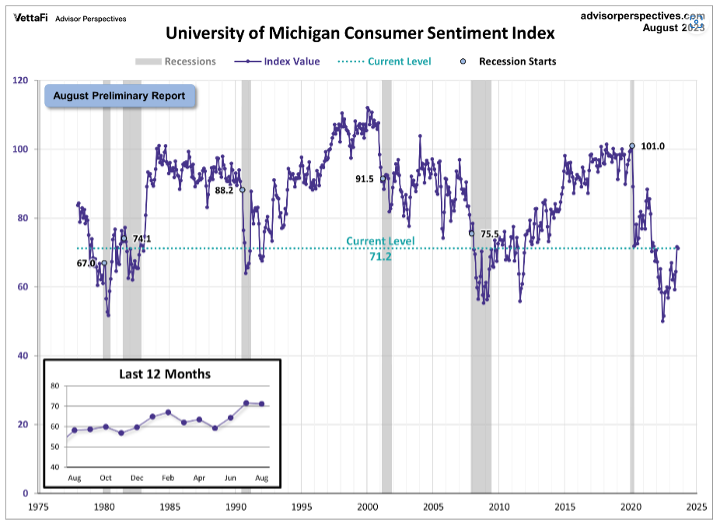
The chart evaluates the historical context for this index as a coincident indicator of the economy. Toward this end, Advisor Perspectives highlighted recessions and included GDP. To put today’s report into the larger historical context since its beginning in 1978, consumer sentiment is 16.3% below its average reading (arithmetic mean) of 85.1 and 15.3% below its geometric mean of 84.0. The current index level is at the 18th percentile of the 548 monthly data points in this series. This indicator is somewhat volatile, with a 3.1-point absolute average monthly change. The latest data point saw a 0.4-point decrease from the previous month.
Similarly, the University of Michigan Survey of Consumers – a survey consisting of approximately 50 core questions covering consumers’ assessments of their personal financial situation, buying attitudes and overall economic conditions – registered 71.6 in July, up 11% from the month prior.
“Overall, the sharp rise in sentiment was largely attributable to the continued slowdown in inflation, along with stability in labor markets,” according to Joanne Hsu, director at Survey of Consumers.
Important Takeaways, Courtesy of Survey of Consumers:
- Year-ahead inflation expectations edged down from 3.4% last month to 3.3% this month. The current reading remains above the 2.3-3.0% range seen in the two years prior to the pandemic.
- Long-run inflation expectations also remained stable at 2.9%, staying within the narrow 2.9-3.1% range for 24 of the last 25 months. These expectations are elevated relative to the 2.2-2.6% range seen in the two years pre-pandemic.
- Sitting at 71.2 index points, sentiment is currently 42% above the all-time historic low reached in June of 2022 and is approaching the historical average reading of 86.
Consumer Income & Spending
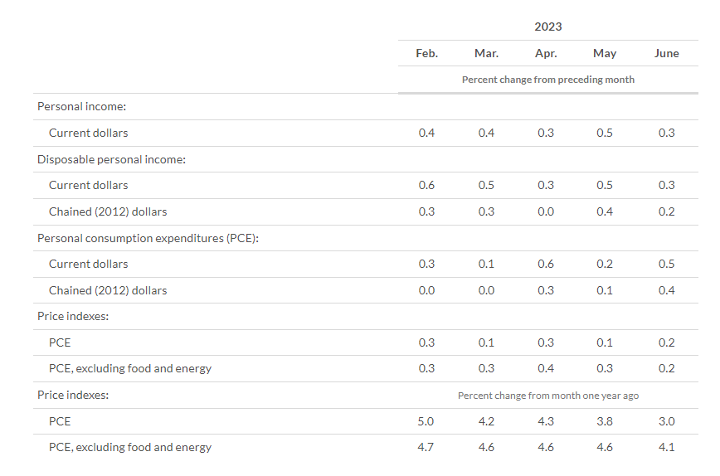
According to the U.S. Bureau of Economic Analysis (BEA), in June 2023 personal income increased $69.5 billion (0.3% at a monthly rate), while disposable personal income (DPI) less personal current taxes increased $67.5 billion (0.3%) and personal consumption expenditures (PCE) increased $100.4 billion (0.5%).
In addition, personal outlays – the sum of PCE, personal interest payments and personal current transfer payments – rose $109.4 billion in June. Personal saving was $862.4 billion and the personal saving rate –personal saving as a percentage of disposable personal income – was 4.3%.
Important Takeaways, Courtesy of BEA:
- In June, the $100.4 billion increase in current-dollar PCE reflected an increase of $51.2 billion in spending for services and an increase of $49.1 billion in spending for goods. Within services, the largest contributors to the increase were financial services and insurance (led by portfolio management and investment advice services), housing and utilities (led by housing) and recreation services. Motor vehicles and parts (led by new light trucks), as well as gasoline and other energy goods (led by motor vehicle fuels, lubricants and fluids), were the largest contributors to the increase in goods.
- The PCE price index for June increased 3% year-over-year. Prices for goods decreased 0.6%, while the prices for services increased 4.9%. Food prices increased 4.6%, but energy prices decreased 18.9%. Excluding food and energy, the PCE price index increased 4.1% year-over-year.
Key Performance Indicators Report — August 2023


