KPI — August 2022: Consumer Trends

The Conference Board Consumer Confidence Index® decreased in July, following a significant decline in June. The Index now stands at 95.7 (1985=100), down 2.7 points from 98.4 in June. The Present Situation Index –based on consumers’ assessment of current business and labor market conditions – fell to 141.3 from 147.2 last month. The Expectations Index – based on consumers’ short-term outlook for income, business and labor market conditions – ticked down to 65.3 from 65.8.
“The decrease was driven primarily by a decline in the Present Situation Index – a sign growth has slowed at the start of Q3. The Expectations Index held relatively steady, but remained well below a reading of 80, suggesting recession risks persist. Concerns about inflation – rising gas and food prices, in particular – continued to weigh on consumers,” says Lynn Franco, senior director of economic indicators at The Conference Board.
As the Fed raises interest rates to rein in inflation, she says purchasing intentions for cars, homes and major appliances all pulled back further in July.
“Looking ahead, inflation and additional rate hikes are likely to continue posing strong headwinds for consumer spending and economic growth over the next six months,” Franco adds.
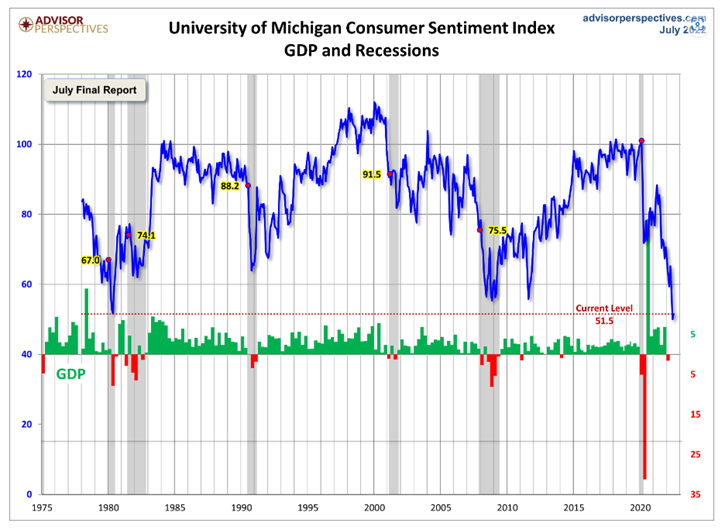
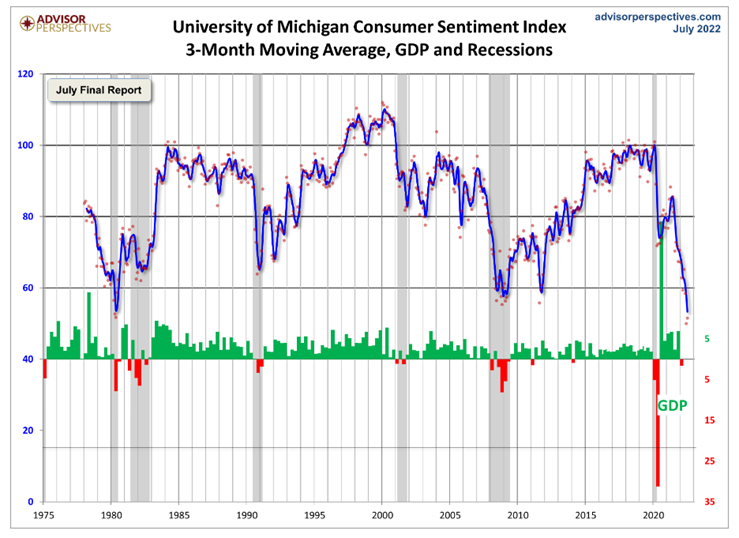
The chart evaluates the historical context for this index as a coincident indicator of the economy. Toward this end, Advisor Perspectives highlighted recessions and included GDP. To put the current report into larger historical context since its beginning in 1978, consumer sentiment is 35.6 percent below the average reading (arithmetic mean) and 34.8 percent below the geometric mean. The current index level is at the 0.7 percentile of the 536 monthly data points in this series. Note this indicator is somewhat volatile, with a three point absolute average monthly change. The latest data point saw a 3.6-point decrease from the previous month.
The Consumer Sentiment Index – a survey consisting of approximately 50 core questions covering consumers’ assessments of their personal financial situation, buying attitudes and overall economic conditions – increased slightly month-over-month to 55.1 from 51.5 but is down significantly year-over-year, according to the University of Michigan Survey of Consumers. Last month was the lowest reading on record, inclusive of consumers across income, age, education, geographic region, political affiliation, stockholding and homeownership status.
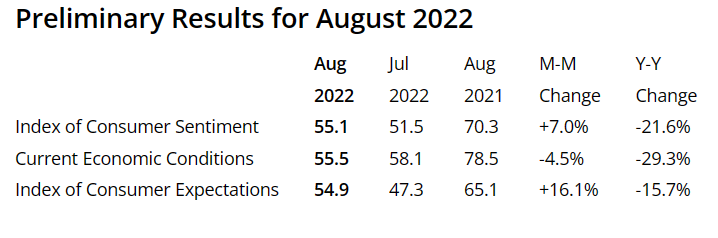
Important Takeaways from Survey of Consumers:
- All components of the expectations index improved month-over-month, particularly among low- and middle-income consumers for whom inflation is particularly salient.
- The year-ahead economic outlook rose substantially to just above its average reading from the second quarter 2022, while the two other expectations index components remain at or below their second quarter averages.
- With continued declines in energy prices, the median expected year-ahead inflation rate fell to 5%, its lowest reading since February but still well above the 4.6% reading from a year ago.
- At 3%, median long run inflation expectations remained within the 2.9-3.1% range seen over the past year.
- Uncertainty over long run inflation receded, with the interquartile range in expectations falling from 4.7 last month to 3.8 this month – remaining above the 3.3 range seen last August.
Consumer Income & Spending
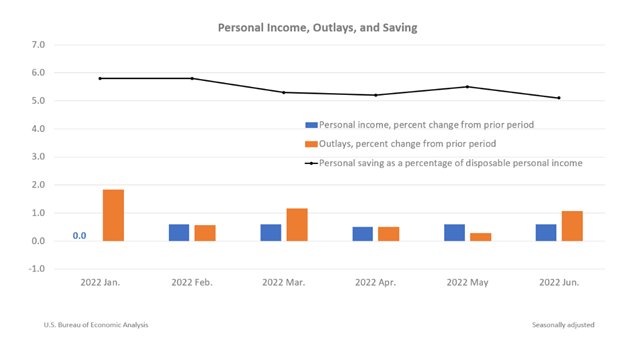
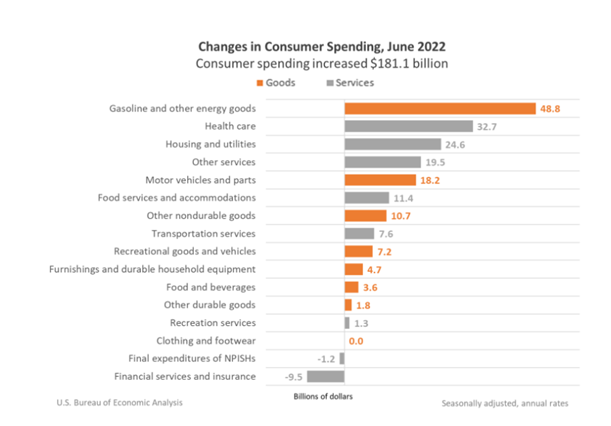
According to the U.S. Bureau of Economic Analysis (BEA), personal income increased $133.5 billion (0.6%) at a monthly rate, while consumer spending increased $181.1 billion (1.1%) in June. The increase in personal income primarily reflected increases in compensation and proprietors’ income. The personal saving rate (personal saving as a percentage of disposable personal income) registered 5.1% in June, compared with 5.5% in May.
Important Takeaways, Courtesy of BEA:
- Primary contributors to the increase in goods were gasoline and other energy goods (led by motor vehicle fuels based on data from the Energy Information Administration), plus motor vehicle and parts (led by new motor vehicles, specifically new light trucks based on unit sales from Wards Intelligence).
- The largest contributors to the increase in services were health care (led by hospitals based on private data and the BLS CES); housing and utilities (led by housing based on housing completions data from the Census Bureau); and “other” services (led by international travel).
- Compared to May, the PCE price index increased 1%. Energy prices increased 7.5% and food prices increased 1%. Excluding food and energy, the PCE price index increased 0.6% month-over-month.
- The personal consumption expenditures (PCE) price index for June increased 6.8% year-over-year, reflecting increases in both goods and services. Energy prices increased 43.5%, while food prices increased 11.2%. Excluding food and energy, the PCE price index for June increased 4.8% from one year ago.
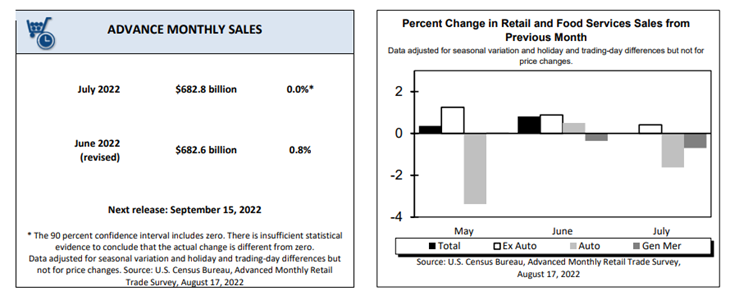
According to the U.S. Census Bureau, advance estimates of U.S. retail and food services sales for July 2022 – adjusted for seasonal variation and holiday and trading-day differences but not for price changes – were $682.8 billion, virtually unchanged (±0.5%)* from the previous month, yet 10.3% (±0.7%) above July 2021. Total sales for the May 2022 through July 2022 period were up 9.2% (±0.5%) year-over-year. The May 2022 to June 2022 percent change was revised from up 1% (±0.5%) to up 0.8% (±0.2%). Retail trade sales were virtually unchanged (±0.4%)* from June 2022, but up 10.1% (±0.7%) year-over-year. Gasoline stations were up 39.9% (±1.6%) from July 2021, while non-store retailers were up 20.2% (±1.2%) from last year.
Key Performance Indicators Report — August 2022


