KPI — April: State of the Economy

Total nonfarm payroll employment fell by 701,000 in March while the unemployment rate rose to 4.4%, according to the Bureau of Labor Statistics. The unemployment rate increase of 0.9 percentage point stands as the largest month-over-month increase since January 1975, and is reflective of the pandemic and efforts to contain it properly.
Subsequently, the number of unemployed persons rose by 1.4 million to 7.1 million during March, with all major worker groups being affected as follows: adult men and adult women – 4%, teenagers – 14.3%, Whites – 4%, Blacks – 6.7%, Asians – 4.1% and Hispanics – 6%. For comparison, February maintained a decades-low unemployment rate of 3.5%. Among major worker groups, the unemployment rates during previous month were as follows: adult men – 3.3%, adult women – 3.1%, teenagers – 11%, Whites – 3.1%, Blacks – 5.8%, Hispanics – 4.4% and Asians – 2.5%.
“National initial jobless claims jumped to 6.6 million for the week ending March 28. This was double the prior week’s record volume of 3.3 million. We will likely see a few more weeks of large new claims numbers, and we could see unemployment reach 10%–16% as a result. The U.S. lost more jobs in the last two full weeks of March than we did for the entire duration of the Great Recession,” said Manheim. “The extent of business closures, declining consumer confidence, and job and income losses point to the U.S. and most of the world heading into a recession quickly. The economic contraction in March and Q2 could be worse than at any point since WWII. The range of likely GDP real contraction for Q2 is from -10% to -18%,” continued Manheim.
Unemployment at the State Level
Unemployment rates were higher during March in 29 states and the District of Columbia, lower in three states and stable in 18 states, according to the Bureau of Labor Statistics. North Dakota had the lowest unemployment rate in March at 2.2%, while Louisiana had the highest rate of 6.9%. The rates in Alaska (5.6%) and Idaho (2.6%) set new series lows. In total, 25 states had unemployment rates lower than the U.S. figure of 4.4%, 13 states and the District of Columbia had higher rates and 12 states had rates that were not appreciably different from that of the nation.
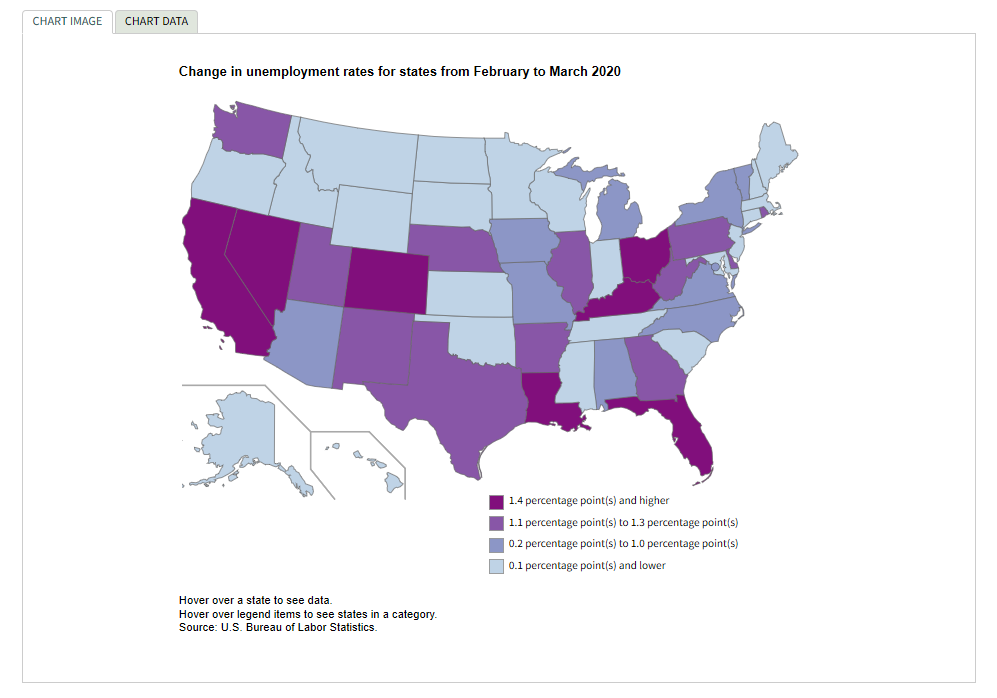
The largest unemployment rate increases occurred in Nevada (+2.7 percentage points) and Colorado (+2.0 points). Additionally, rates rose month-over-month by at least a full percentage point in 19 additional states. Alaska had the largest jobless rate decrease from February (-0.2 percentage point). Eighteen states had rates that were not notably different from those of a month earlier, though some had changes that were at least as large numerically as the significant changes.
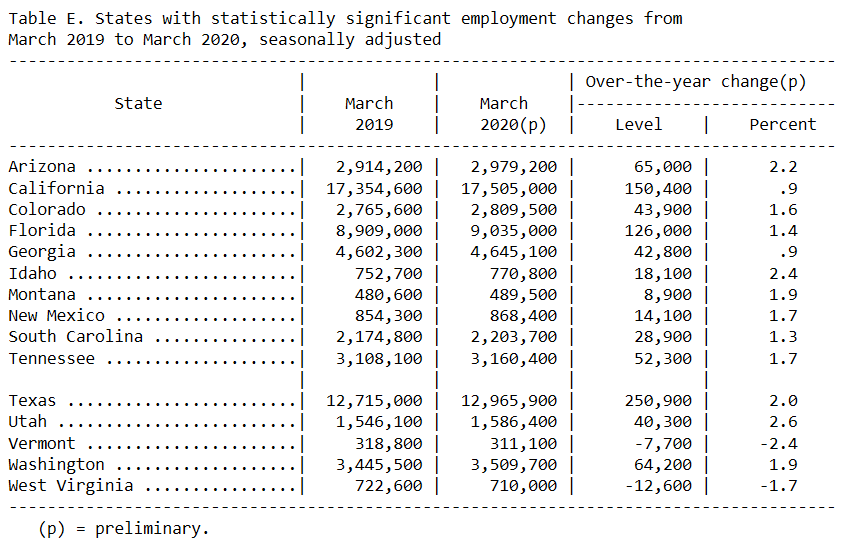
Caption: Thirteen states had over-the-year increases in nonfarm payroll employment in March, two had decreases and 35 states and the District of Columbia were unchanged. The largest job gains occurred in Texas (+250,900), California (+150,400) and Florida (+126,000). The largest percentage gains occurred in Utah (+2.6%), Idaho (+2.4%) and Arizona (+2.2%). Employment decreased in Vermont (-7,700, or -2.4%) and West Virginia (-12,600, or -1.7%). (See table E.)
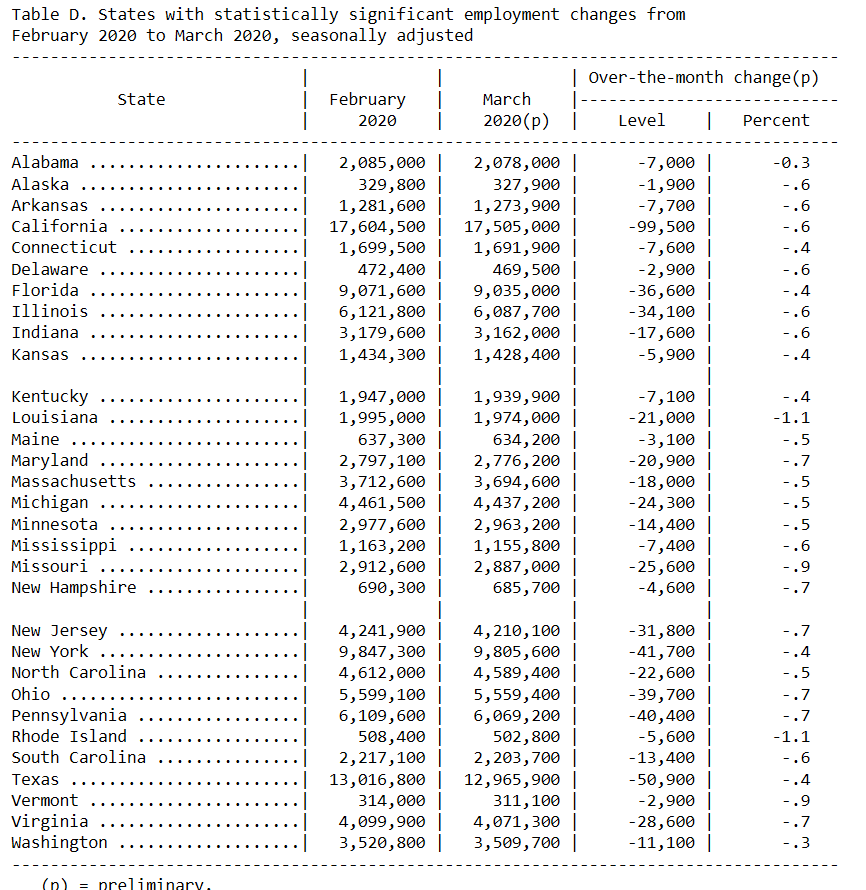
Caption: The largest unemployment rate increases from March 2019 occurred in Louisiana (+2.4 percentage points), Nevada (+2.2 points) and Pennsylvania (+1.9 points), with another 12 states experiencing increases of a full point or more. The largest unemployment rate decreases over the year were in Oregon and South Carolina (-0.8 percentage point each). Nonfarm payroll employment decreased in 31 states in March 2020. The largest job declines occurred in California (-99,500), Texas (-50,900) and New York (-41,700). The largest percentage declines occurred in Louisiana and Rhode Island (-1.1 percent each), followed by Missouri and Vermont (-0.9 percent each). (See table D)
Economic Impact at the Job Level
*All data is courtesy of the Bureau of Labor Statistics
• Leisure and hospitality fell by 459,000. Most of the decline occurred in food services and drinking places (-417,000). This employment decline nearly offset gains over the previous 2 years.
• Employment in the accommodation industry also declined (-29,000).
• Employment in health care and social assistance fell by 61,000. Health care employment declined by 43,000, with job losses in offices of dentists (-17,000), offices of physicians (-12,000) and offices of other health care practitioners (-7,000). Over the prior 12 months, health care employment had grown by 374,000.
• Social assistance saw an employment decline of 19,000, reflecting a job loss in child day care services (-19,000). Over the prior 12 months, social assistance added 193,000 jobs. Employment in professional and business services decreased by 52,000, with the decline concentrated in temporary help services (-50,000).
• Employment also decreased in travel arrangement and reservation services (-7,000).
• Retail trade declined by 46,000. Job losses occurred in clothing and clothing accessories stores (-16,000); furniture stores (-10,000); and sporting goods, hobby, book and music stores (-9,000). General merchandise stores gained 10,000 jobs.
• Employment decreased over the month in construction (-29,000). In March, nonresidential building (-11,000) and heavy and civil engineering construction (-10,000) lost jobs. Construction employment had increased by 211,000 over the prior 12 months.
• Employment in the other services industry declined by 24,000 in March, with about half of the loss occurring in personal and laundry services (-13,000).
• Mining lost 6,000 jobs in March, with much of the decline occurring in support activities for mining (-5,000). Since a recent peak in January 2019, mining employment has declined by 42,000.
• Manufacturing employment edged down (-18,000). Over the past 12 months, employment in the industry has shown little net change.
• Federal government employment rose by 18,000 in March, reflecting the hiring of 17,000 workers for the 2020 Census.
• Employment in other major industries, including wholesale trade, transportation and warehousing, information and financial activities changed little over the month.
States with the sharpest declines in the number of jobs include: California (−99,500 jobs or −0.6%, Texas (−50,900 or −0.4%) and New York (−41,700 or −0.4%). Pennsylvania, Ohio, Florida, Illinois and New Jersey had employment changes ranging from −40,400 to −31,800 during March 2020.


